Step-test measurement options
Every digital negative or digital positive approach needs some method for evaluating how much correction needs to be applied to a digital input file in order to create a final print where the tones in the prints match the tones on the monitor.
Measuring step tests
There are several approaches that can be used for creating a measurement file that programs such as QuadToneProfiler QuickCurveDN can then use to create a linearized output for making digital negatives for traditional and alternative photographic processes.
Traditional reflection densitometers
Anyone who began photography in the age before digital cameras probably remembers a piece of equipment called a densitometer. There are two types that are typically seen: reflection and transmission densitometers. Some densitometers make both types of measurements, but the one of interest to those making digital negatives or positives is the reflection densitometer, which measures the amount of light reflected from a print. Darker black areas of a print reflect little light, whereas lighter areas reflect lots of light. These instruments make measurements that in logD. This measurement value can be input into a file that some of the digital negative programs can use directly. There are densitometers still being manufactured such as the Heiland TRD 2 that measure both reflective and transmissive logD values.
The main downside to using a reflection densitometer is that it requires the conversion of logD to L values. Many programs such as QuadToneProfiler QuickCurveDN do this math for you, but if you are using other approaches, it may necessitate plugging the values into a spreadsheet that converts these values for you.
Scanning a step-test on a flatbed scanner with a Q-13 target
Another approach that is relatively inexpensive for making measurements is scanning a step test side-by-side with a Q-13 reflective target. Particuarly for those using QuadToneRIP who already own a flatbed scanner, this can represent a very inexpensive approach. Q-13 targets can be purchased online at BH Photo Video, Adorama, and Freestyle Photo.
This approach is particularly useful for people using QTR, and is sort of automated by using the QTR-StepWedgeTool, a Photoshop script that can be downloaded here. The process is slightly ‘touchy’, and requires you to outline the Q-13 target first, and then the 21-step test, and finally save the results to a file. The results are good, however, and the only downside is that it only works on a 21-step (5% gray increments) step test. Detailed instructions are included with the download, and there are some YouTube videos that also demonstrate how to use this tool.
Measuring a step-test using an X-Rite i1 Spectrophotometer
This approach is probably the most accurate, but this accuracy comes at some expense. New i1 Spectros cost around $1650 for a new base model at BH Photo Video and getting one fully tricked out can be close to $7000. One benefit of this approach is that the same instrument can be used to calibrate your monitor, which is necessary if repeatable results are needed. There are less expensive monitor-only spectrophotometers available however, and one of these should only be purchased if you intend to use it for additional print profiling and digital negative creation tasks.
Used i1 spectrophotometers can be found on eBay for prices between $150 and $500. When looking at used i1 spectros, make sure that you are buying an i1 Pro2 Rev E or newer model. The program needed to interface with this device is the i1Profiler (i1 Publish) software. Many features of this program must be licensed, but by clicking the ‘advanced’ button, a workflow named ‘Measure Chart’ becomes visible and may be used without needing any additional licensing.
Use an inexpensive handheld colorimeter such as the Color Muse
A final tool that can be used is a handheld colorimeter such as the Color Muse. This tiny little instrument is used by decorators and designers to make onsite measurements of colors. It is used by pairing it via Bluetooth to your smartphone, and using an app as the interface to your colorimeter. When a measurement is taken, the app displays the LAB values along with a matching paint color! Of course, we don’t need a paint color, but the LAB values are very useful for us photographers.
The main downside to this instrument is that it does not have a native software interface that will generate the necessary measurement file. This means that you will have to record each individual measurement in a text file and then run it through QTR-Data-Tool to generate your measurement file, or use the little javascript web form I have created here to enter the values which can then be copied and pasted into a text file that can be read by the BW Mastery family of apps.
A more detailed post about the Color Muse is available here.
Summary
There are four good approaches to making measurements to be used for digital negative and digital positive linearization, and three of them generate LAB values directly.
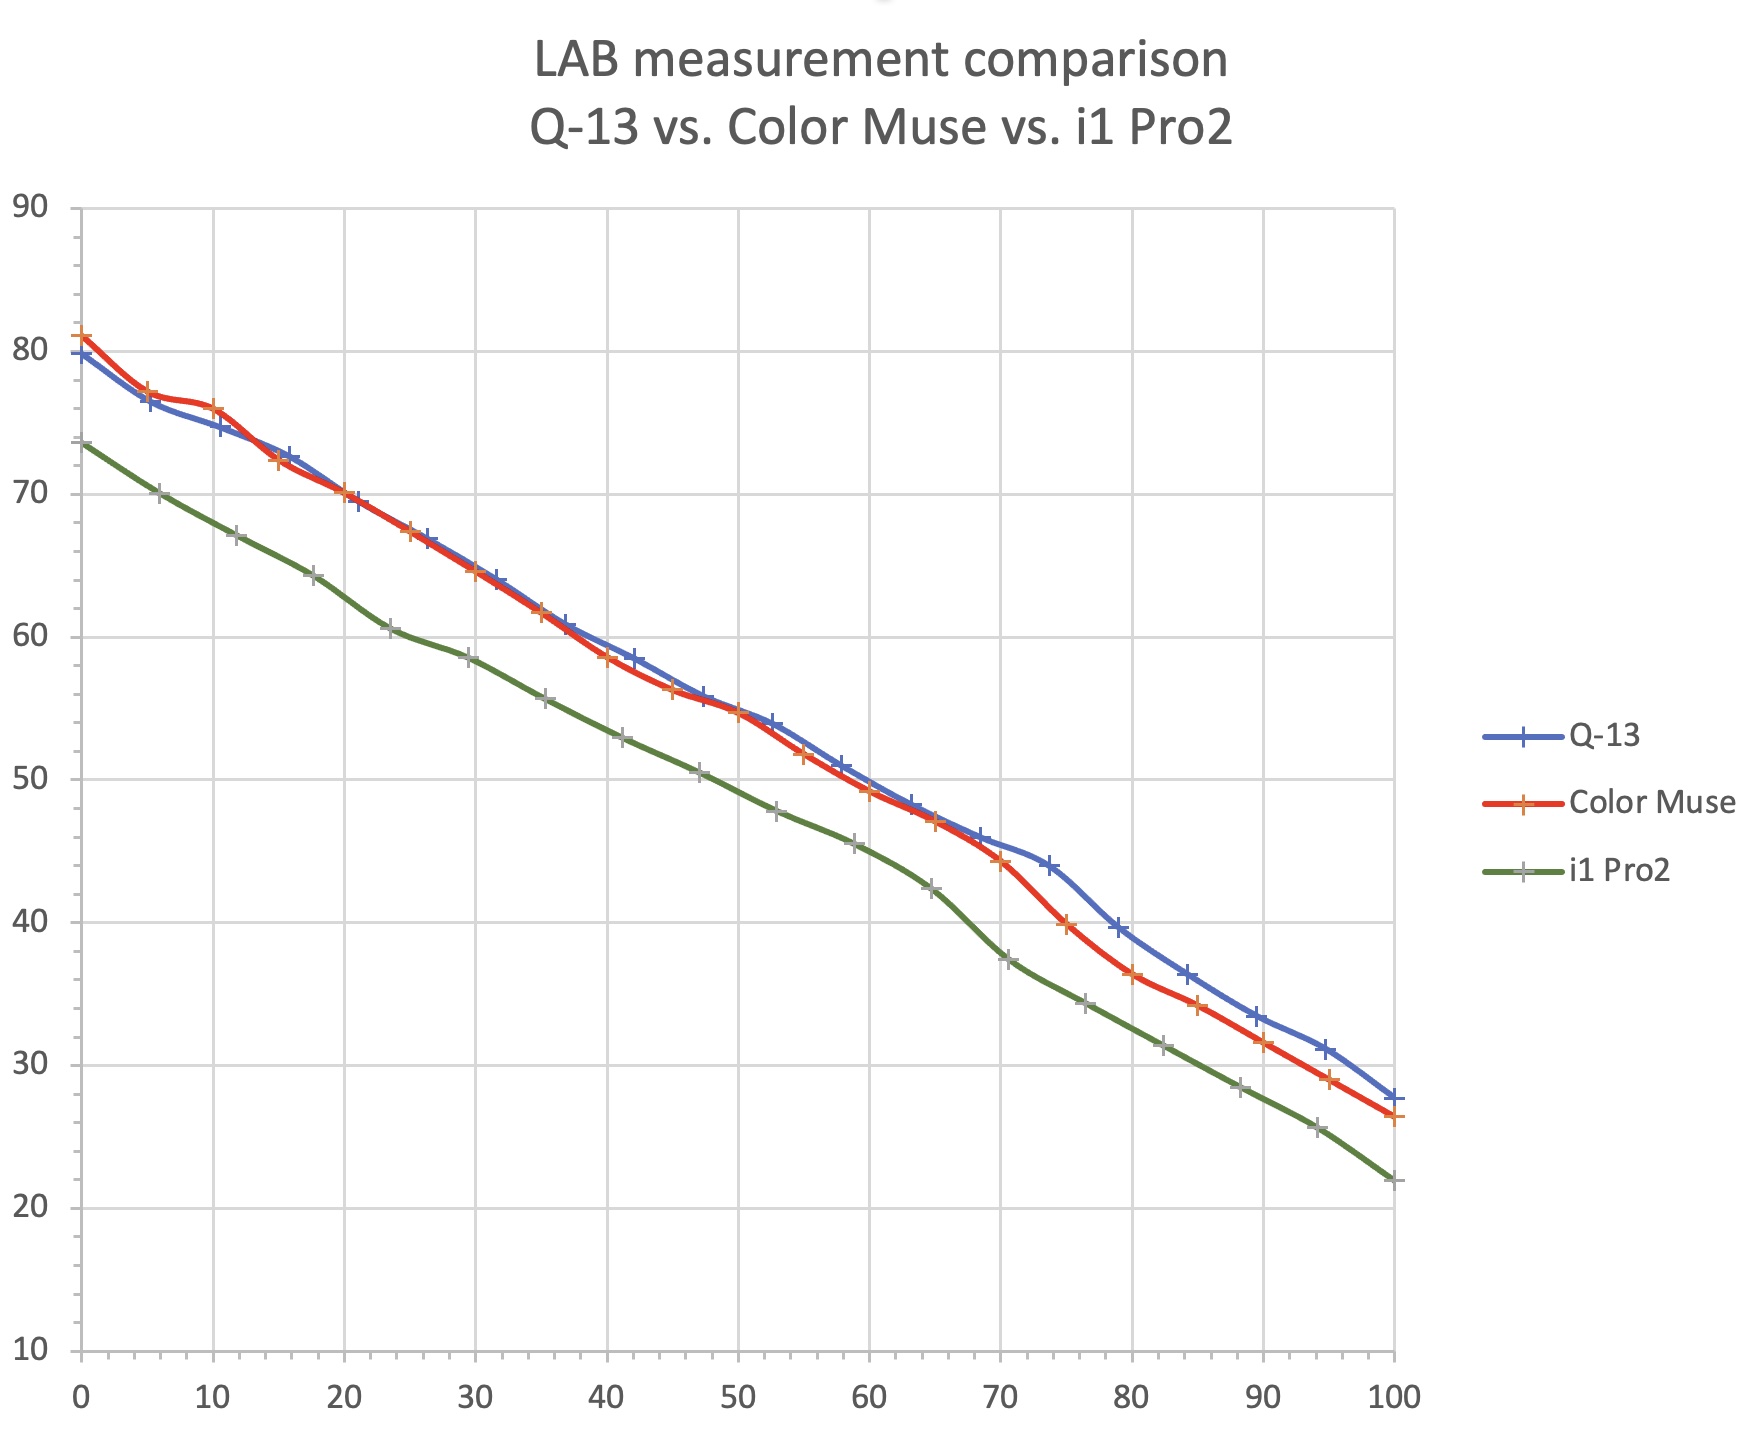
The main purpose of any technique is to establish linearity of luminance (the L in LAB). The absolute values from each technique are less important. I measured the same printed step test recently using all three LAB techniques, and below is a graph plotting the results they generated. The main thing you will notice is that the i1 has noticeably different LAB values, but that all three techniques generate measurements that show the same slope of values. That is the critical element, since the linearization techniques are only trying to establish an even progression of L values from darkest to lightest.

