QuickCurve calibration for polymer intaglio
Introduction
Polymer plate calibration for photogravure intaglio prints is one of the more intimidating tasks that beginning photogravurists encounter. What makes this process both daunting and unfamiliar is that two exposures are used to expose the plates prior to their being etched in a water bath.
In order to get an intaglio plate capable of holding ink in the most deeply etched areas of the plate, an aquatint screen is used as the so-called screen exposure, which creates a random sea of tiny ‘needles’ (sometimes called ‘lands’ in traditional printmaking jargon) on the plate that hold in place deep deposits of black ink (sometimes called ‘pits’) that the intense pressure of the etching press pulls out of the plate and embeds in the paper fiber. This aquatint would print as a solid black if a second image exposure using a positive were not superimposed on it.
These two separate exposures are not independent of one another. The second image exposure adds exposure to the the tiny needles that are created by the aquatint exposure. The interdependence of these two variables is what can make first-time photogravure platemakers go crazy.
There are a number of approaches and systems that can be used to arrive at a well-calibrated platemaking workflow that yields final photogravure prints that closely match the image that is being worked on in an image-editing program such as photoshop. What these approaches all have in common is a closely-calibrated system where the digital image, the monitor, the positive from the inkjet printer and the exposed and etched plate are all carefully joined together in a methodical workflow.
What follows is a straightforward method to achieve a properly calibrated plate that uses the QuadToneProfiler QuickCurve app, the QuadToneRIP PrintTool and a print reflectance measurement instrument. This last item can be a spectrophotometer such as the X-Rite i1Pro series instruments, or alternatively, a flatbed scanner used in conjunction with a calibrated reflectance step wedge and the QTR StepWedgeTool.
Tools, Materials, Software and digital files
Polymer platemaking material and equipment.
This tutorial assumes that you have experience making plates, or have instructions that will guide you through the process. The basic steps are:
- Make an aquatint exposure using a stochastic screen
- Make an image exposure using the image positive
- Etch the plate in water
- Dry and set the polymer with heat
- Make a third exposure to harden the polymer
- Trim the plate
- Ink, wipe and print the plate on an etching press
QuadToneProfiler version 1.1 or higher software
QuadToneRIP software installed for your Epson printer
QTR PrintTool software for printing
Please note that this tutorial assumes you are using the MacOS version of the QuickCurve software.
Download the following files from my website
- A6-ScreenTest.tif
- A6-Screentest-Template.pdf
- A6-StepTest.tif
Some type of measurement device
Some method for creating a file with LAB values for the linearization steps. I use an XRite i1Pro2 spectrophotomer and i1 Profiler software. Another alternative is to use the QTR-StepWedge-Tool app available here and a flatbed scanner in conjunction with a calibrated reflectance target such as the Tiffen Q13 to generate the measurement files
Overview of the calibration steps
- Using QuadToneProfiler, create a QTR quadfile starter curve.
- Print the A6-Screentest.tif file with PrintTool using a starter curve and no color management.
- Perform the screen test exposure series and process the plate and print the plate with your chosen ink and paper.
- Evaluate the screentest and determine the limits for shadow and highlight values.
- Use the Quad-Limiter tool to create a limited quad with these values.
- Print the A6-StepTest evaluation file with this new quad file.
- Using the printed A6-StepTest positive, expose, process and print the plate.
- Measure the 21-step series on the print using either a spectrophotometer or a calibrated target and flatbed scanner.
- In the QuadToneProfiler linearization tab, load the measurement data and adjust the smoothing sliders to make a nice smooth curve through the measured points. Load the limited quad and create a new .quad curve that is linearized with the 21-step information.
- Print the 51-step evaluation file again with the 21-step linearized quad file.
- Make another plate with this positive and expose, process and print the plate.
- Measure this print using the 51-step series, creating a new 51-step measurement file.
- In the QuadToneProfiler linearization tab, load this 51-step measurement data and adjust the smoothing sliders as in the previous steps. Load the 21-step linearized quad file and use the 51 step measurements to create a new 51-step quad file.
- Print the 51-step evaluation file again with the new 51-step linearized quad file.
- Make another plate with this positive and expose, process and print the plate.
- Measure this print using the 51-step series, and confirm that your quad file is close to perfectly linear.
- Iterate the process if needed to get the linearized 51-step measurements.
- Print a test image using PrintTool.
Detailed description
Create a Quadfile starter curve
The instructions with the BWMastery QuadToneProfiler QuickCurve app are quite good, so I will not cover anything that cannot be found on Richard’s website. One really helpful hint he outlines is to navigate to /Application/QuadToneRIP/Profiles and find the appropriate installation folder for your printer. Make a copy this folder inside the Profiles folder and rename it something like 7800-QCDP and delete everything except for the installation script. This will be your QuadtoneRIP printer for this specific process and leaves no chance that you will be confused when printing your positives.
Open the QuadToneProfiler app and make sure you are on the Starter Curve Setup tab. Choose a black ink limit, and then click the Save Current Starter Curve button and name it something informative like starter and then save it to your newly created process-specific QTR installation folder.
The inkload requirements for polymer photogravure positives are not extreme. I recommend keeping it simple and choosing a maximum black ink level of something in the 50-55% range.
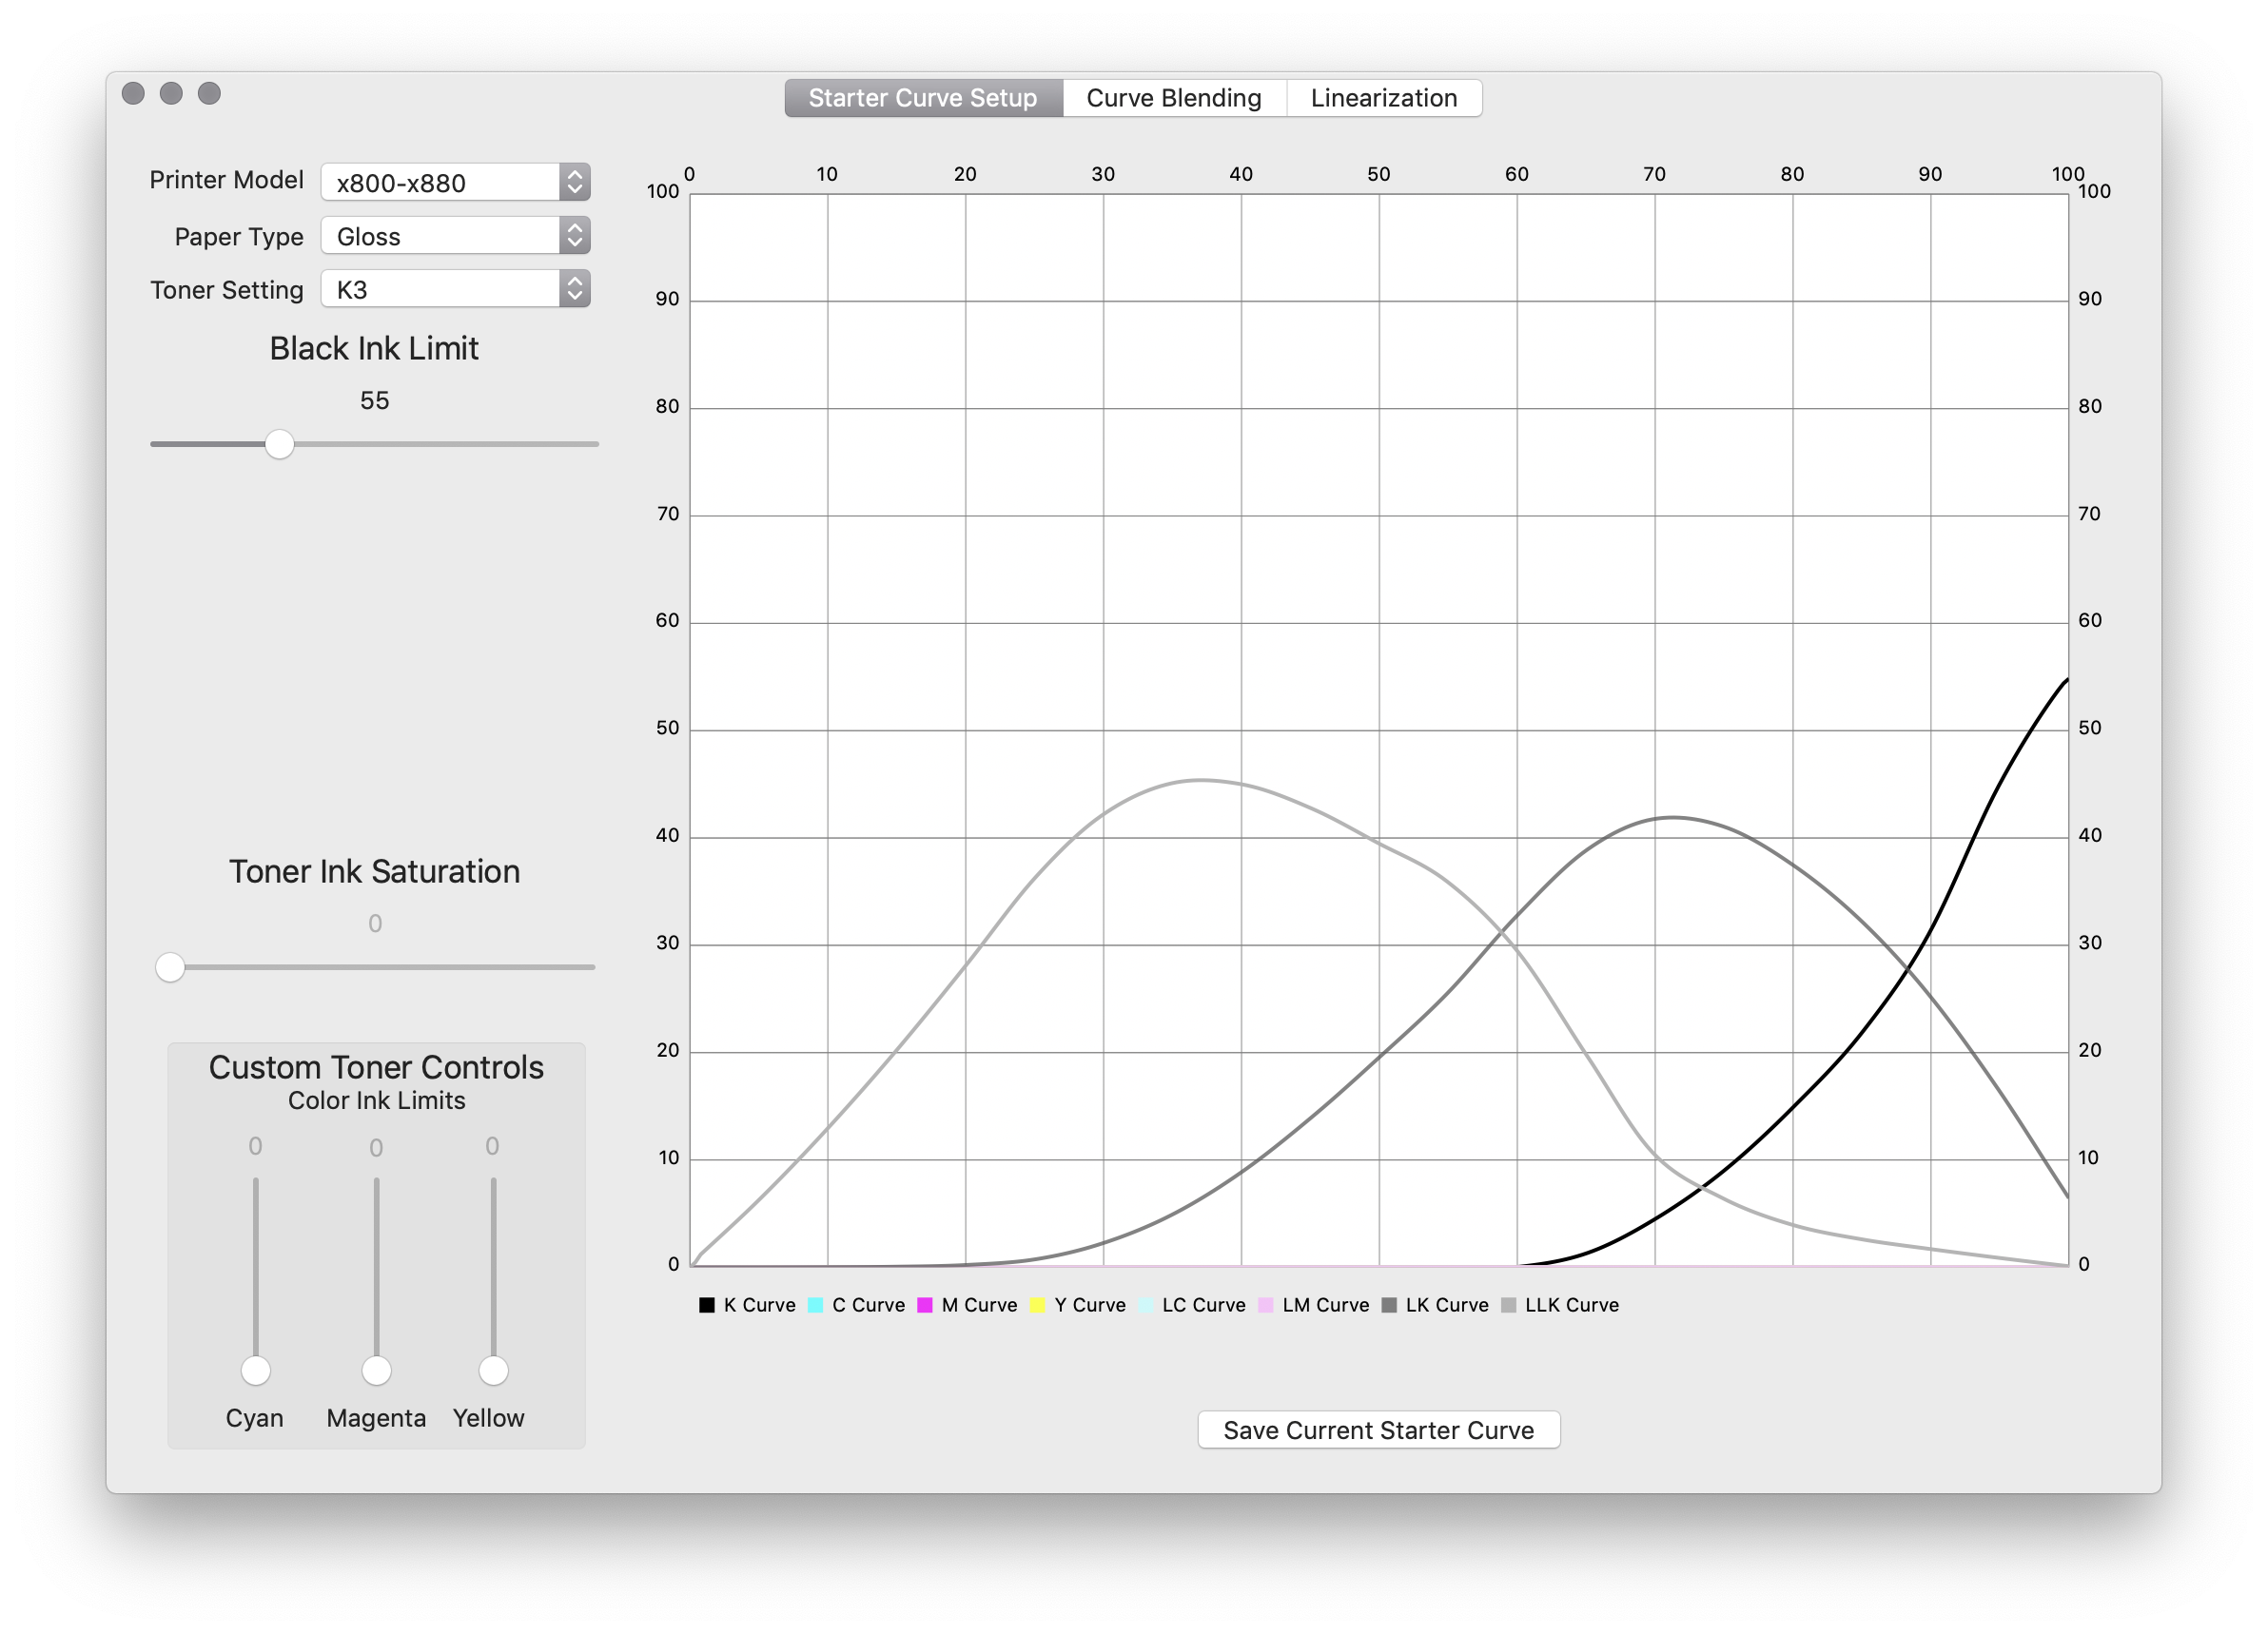
Loads of ink is not required - try a black ink limit in the 50-60% range.
Print the A6-ScreenTest image using the starter curve
Now print the A6-ScreenTest.tif image using PrintTool with No Color Management selected in the Print Color Management Section. Choose the Starter curve in the QuadToneRIP Curve Selection part of the Print Dialog. Just before printing you should see something like this:
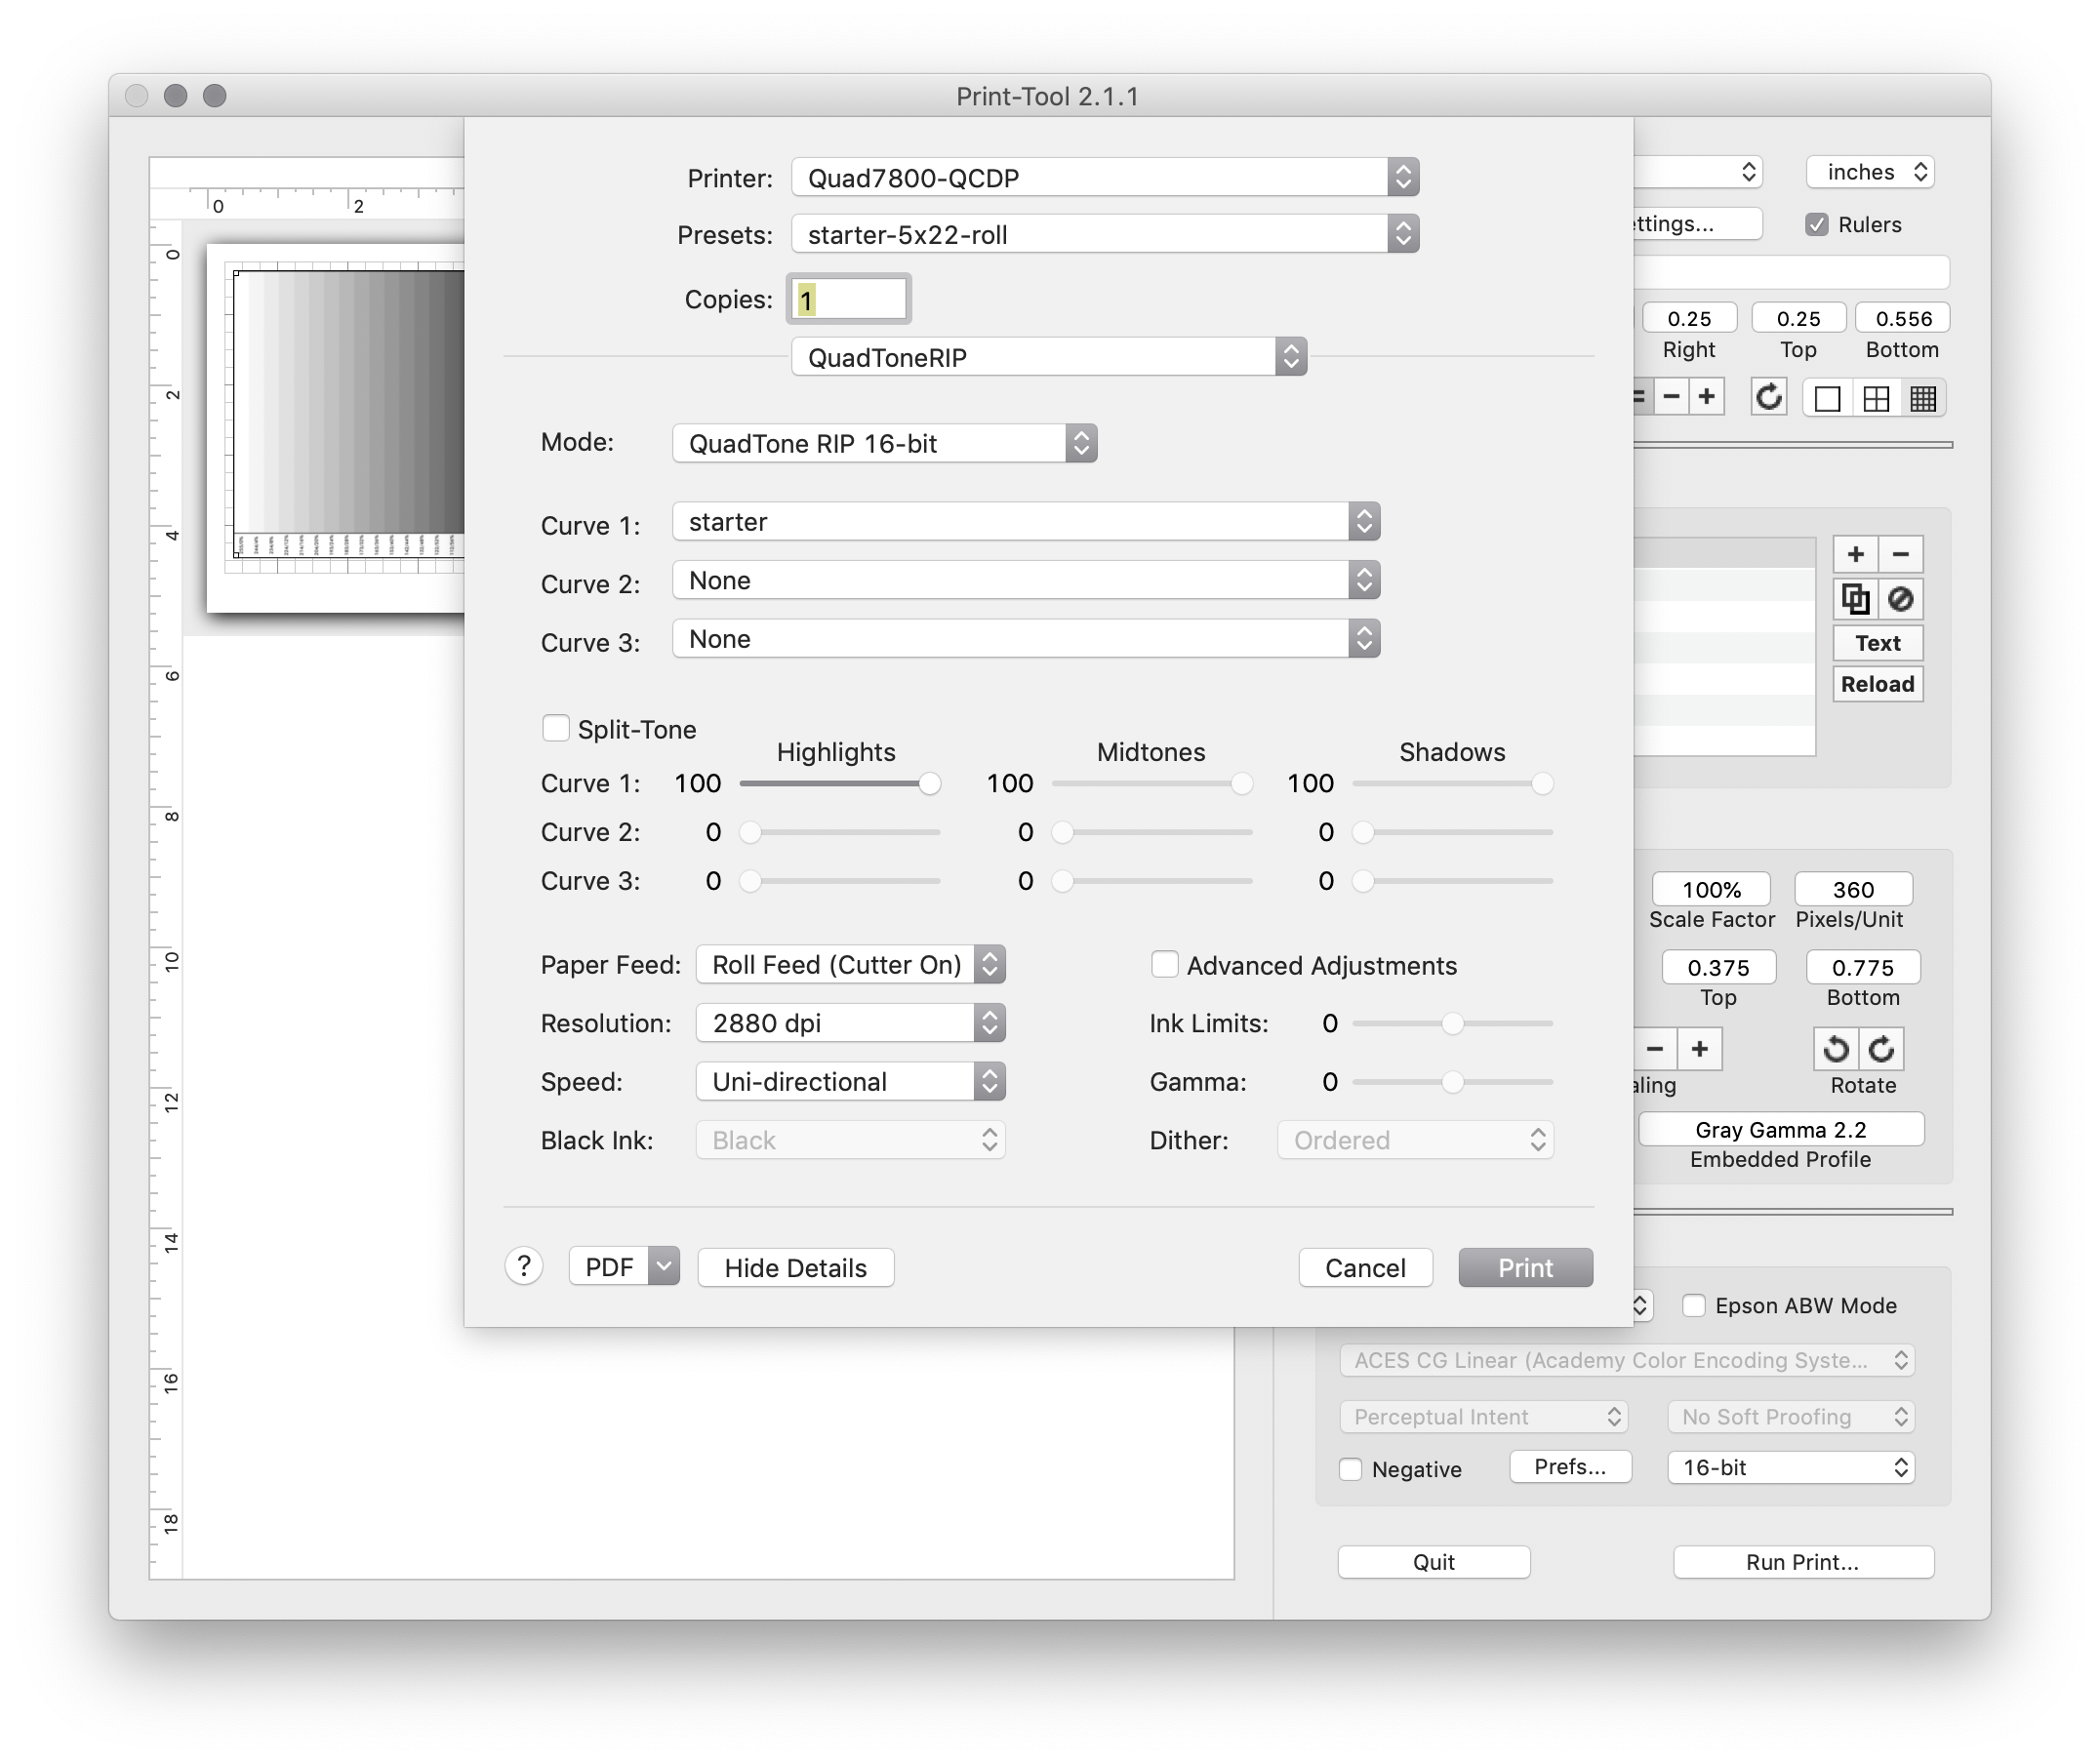
Later you may choose to use PrintTool managed color for your output, but for calibration turn off Color Management’.
Thoroughly dry the positive before using it in the next step.
Use the A6-ScreenTest positive to determine screen exposure
Print out the A6-ScreenTest-Template.pdf file on a laser printer or any inexpensive method you have. Make sure it is printed at 100%.
Cut a plate to A6 size. I have made all the image files and templates for this process correspond to standard ISO sizes, so if all goes well, you will be able to cut a standard A4 sized plate into 4 A6 pieces and you can complete your calibration with only a single sheet! I also recommend trimming a small piece from the upper right corner of the plate so that the orientation of the plate can be maintained between the screen exposure series and the image exposure.
Peel the protective wrap from the A6 plate and place it on the template in the gray area. Now place your the aquatint screen on the plate with the dull side against the polymer. Place this three-stack layer in your exposure unit or printing frame so that the light will pass through the aquatint screen onto the plate. Take an opaque card and place it over all but the far right hand column marked on the template. It should look something like this:
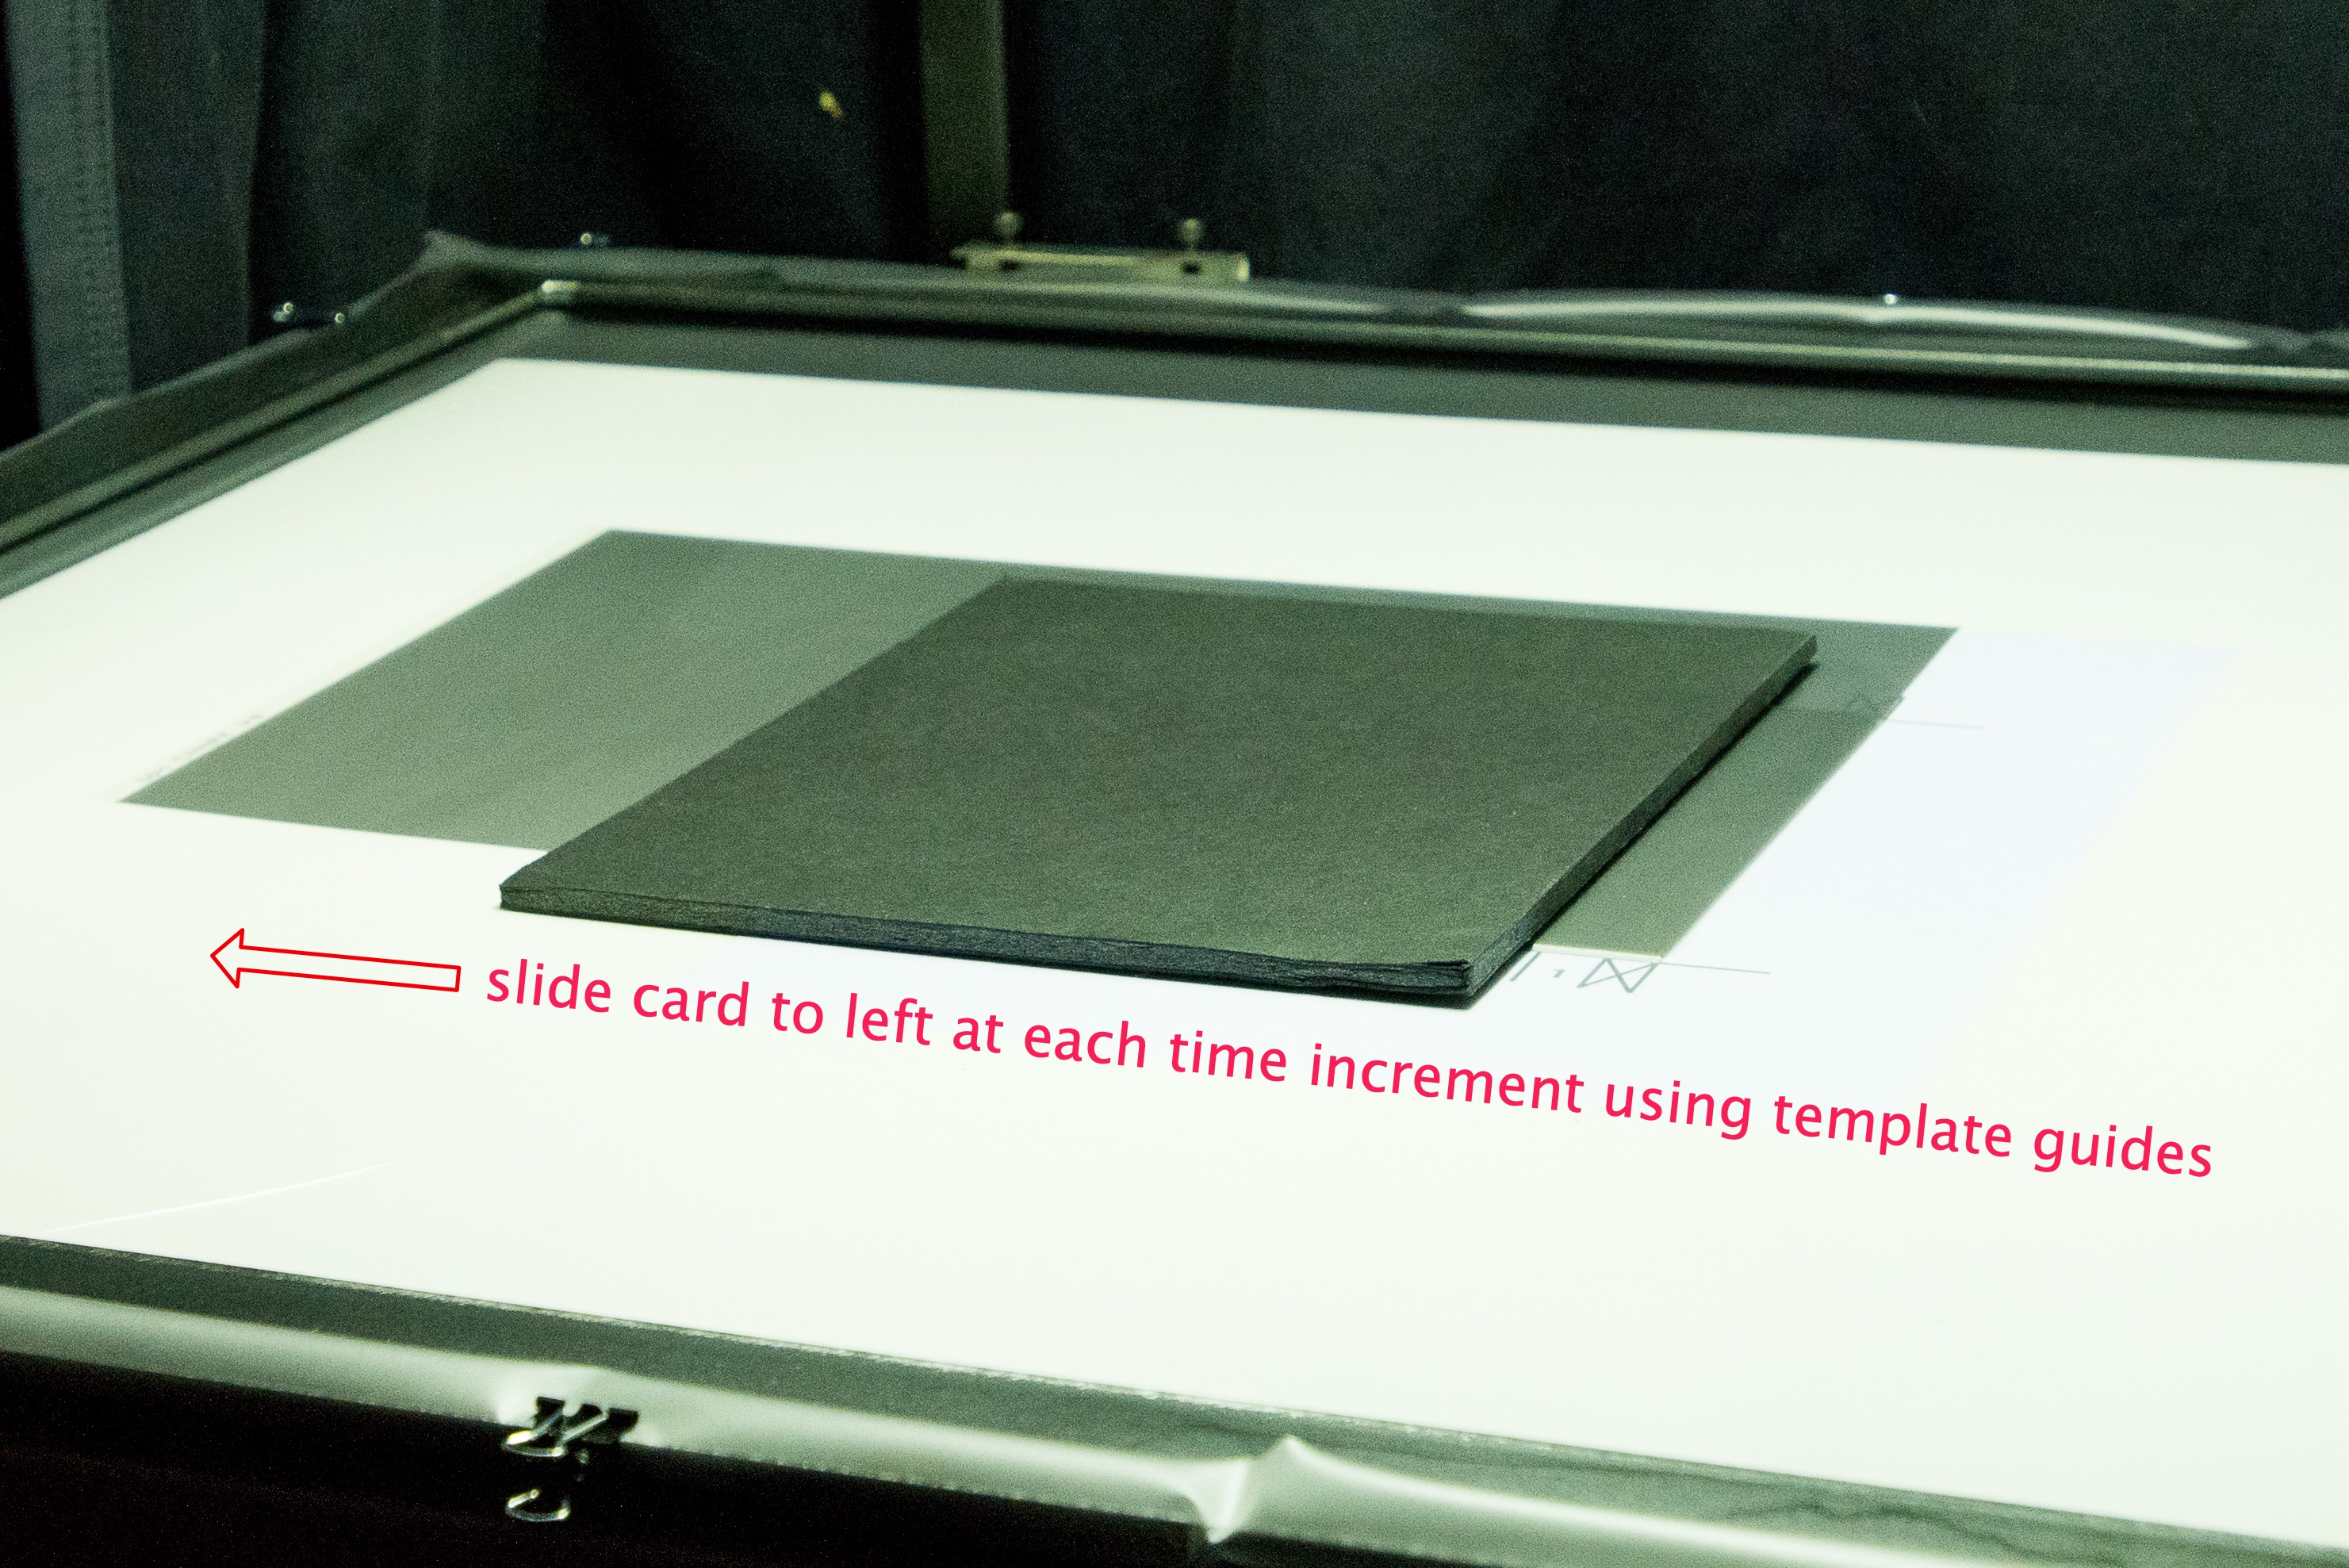
The opaque card is moved to the left at regular exposure value increments.
Choose a starting time that is 50-100% greater than the typical time normally recommended for the plate and screen combination and divide this time by 8. There are 8 exposure strips on the template that will be used to generate a series of 8 different exposures for the aquatint screen.
Start the exposure and at each time increment, slide the card to the left revealing another strip of material to the exposure light. When the exposure series is complete, wait for the light to completely extinguish and then remove the plate and aquatint screen. Dust the plate lightly with anti-offset powder and brush off any visible power.
Place the A6-ScreenTest positive image on the plate with the inked side down against the plate material. The numbers on this positive should be on the right side of the plate (which is why we clipped the upper right hand corner of the plate!).
Pick an image exposure time toward the middle values of the aquatint screen exposure series. In the example you will be seeing, I chose a maximum screen exposure value of 80 and counted down. This test only went to 30 because I had a scrap of plate that was skinnier than the typical A6 plate. I chose an image exposure value of 60 based on my previous experience with this material.
Expose the plate to the positive, and the process, dry and post harden the plate. Pro tip: use an X-acto knife and the template to make small grooves in the plate at the divisions between the exposure strips in the series before the hardening exposure. This will make it easier to see which strip matches which exposure after you print it. Make a print with the plate using the paper, ink and press settings you intend to use.
Evaluate the screen test
Using a pen mark the different screen exposure values on the base of the print you just made. Remember that you went right to left on the screen exposure series which means the resulting print will go left to right!
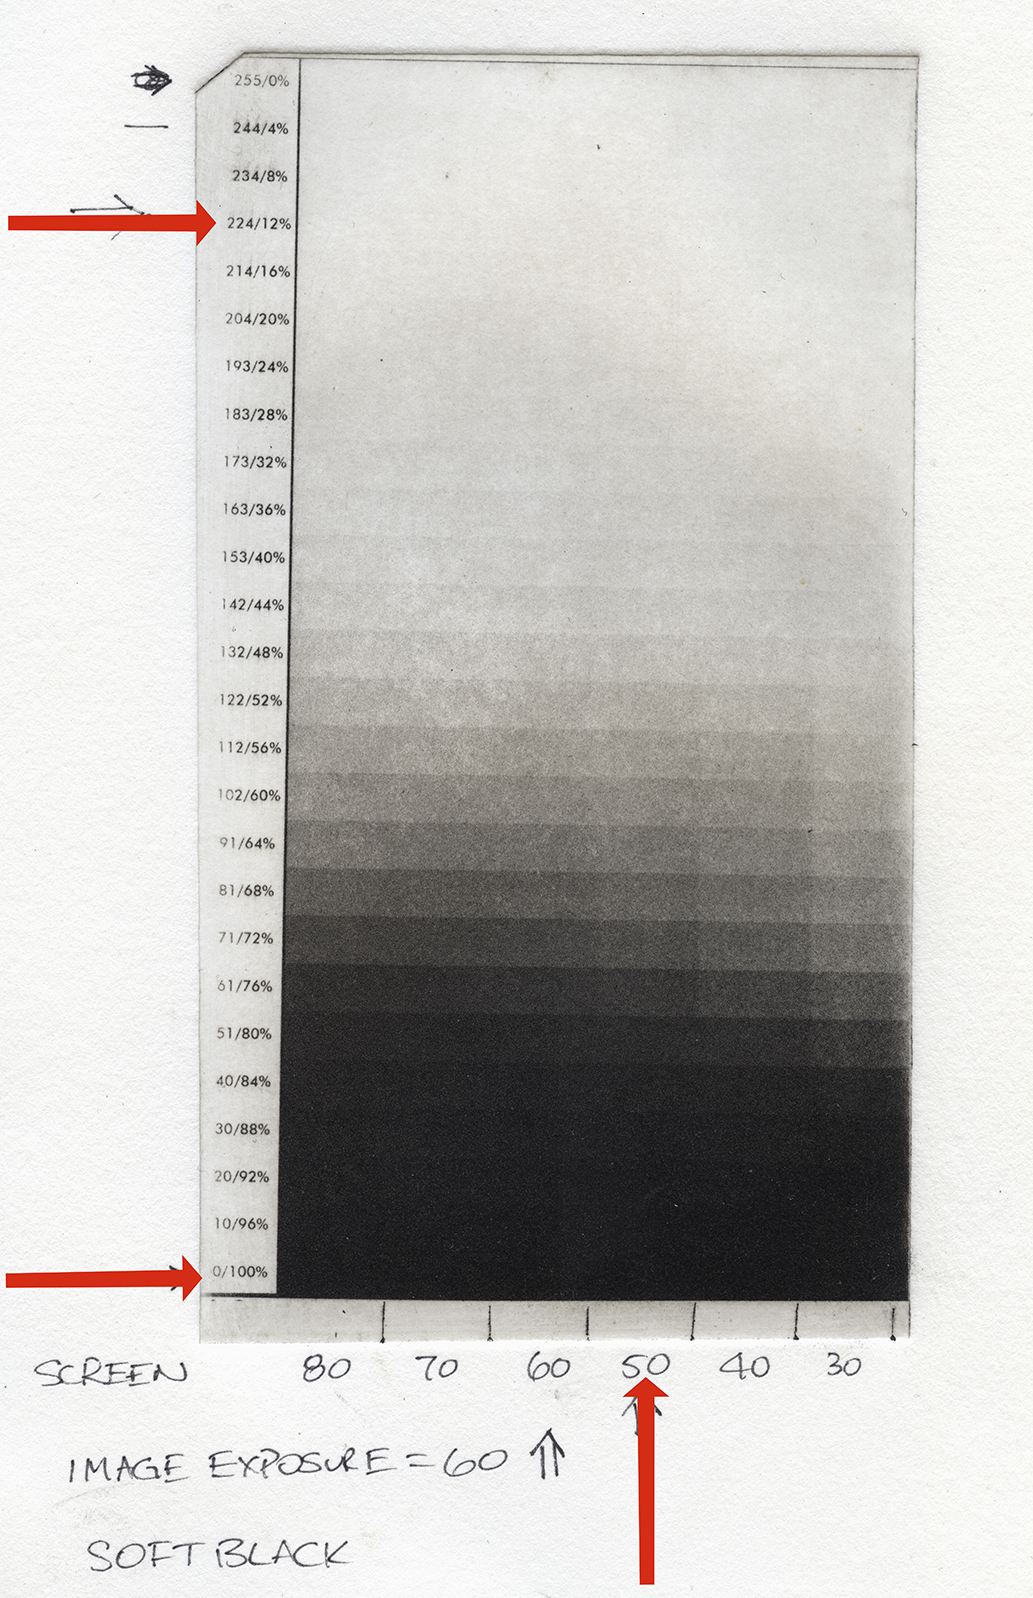
This print is used to pick 1) the screen exposure value, 2) the shadow value level, and 3) the highlight value level’.
There are three things you will be deciding from this print, and do it in this order:
Pick the aquatint screen exposure In the example I chose 50 because it had the deepest black values without the plate being too etched. Although it may not be apparent in this scan, the higher screen values of 80, 70, and 60 were all just barely lighter in tone. The values of 40 and 30 were dark but I noticed that the lowest values held too much ink and were no darker than 50. This step involves a little judgement, but will become second nature with a little experience.
Pick the Shadow Level Value from the vertical column. Find the first dark tone that is ever-so-perceptibly lighter than the tone below it. The tone below it will be the Shadow Level Value. In this example, I chose 0 (100% black). But it all depends on the material. Write this number down.
Pick the Highlight Level Value from the vertical column. Find the first light tone that is the same tone as the one above it. In this example, I chose 224 (12% black). I find this step to be trickier for myself and students, partly because it is so dependent on wiping technique. When I held this test strip in bright light, it appeared that every tone above 224 was the same paper white (or almost - there is always some plate tone in the process), and the tones below it began to get slightly darker. Write this number down.
Use the BWMastery Quad Levels Utility tool to create a limited quad
Open the Quad Levels Utility functionality by selecting it from the Windows->Quad Levels Utility menu or use the keyboard shortcut Command-L and click on the Open Quad File button and navigate to the QTR profile folder which you created the starter quad file. Select this file and open it.
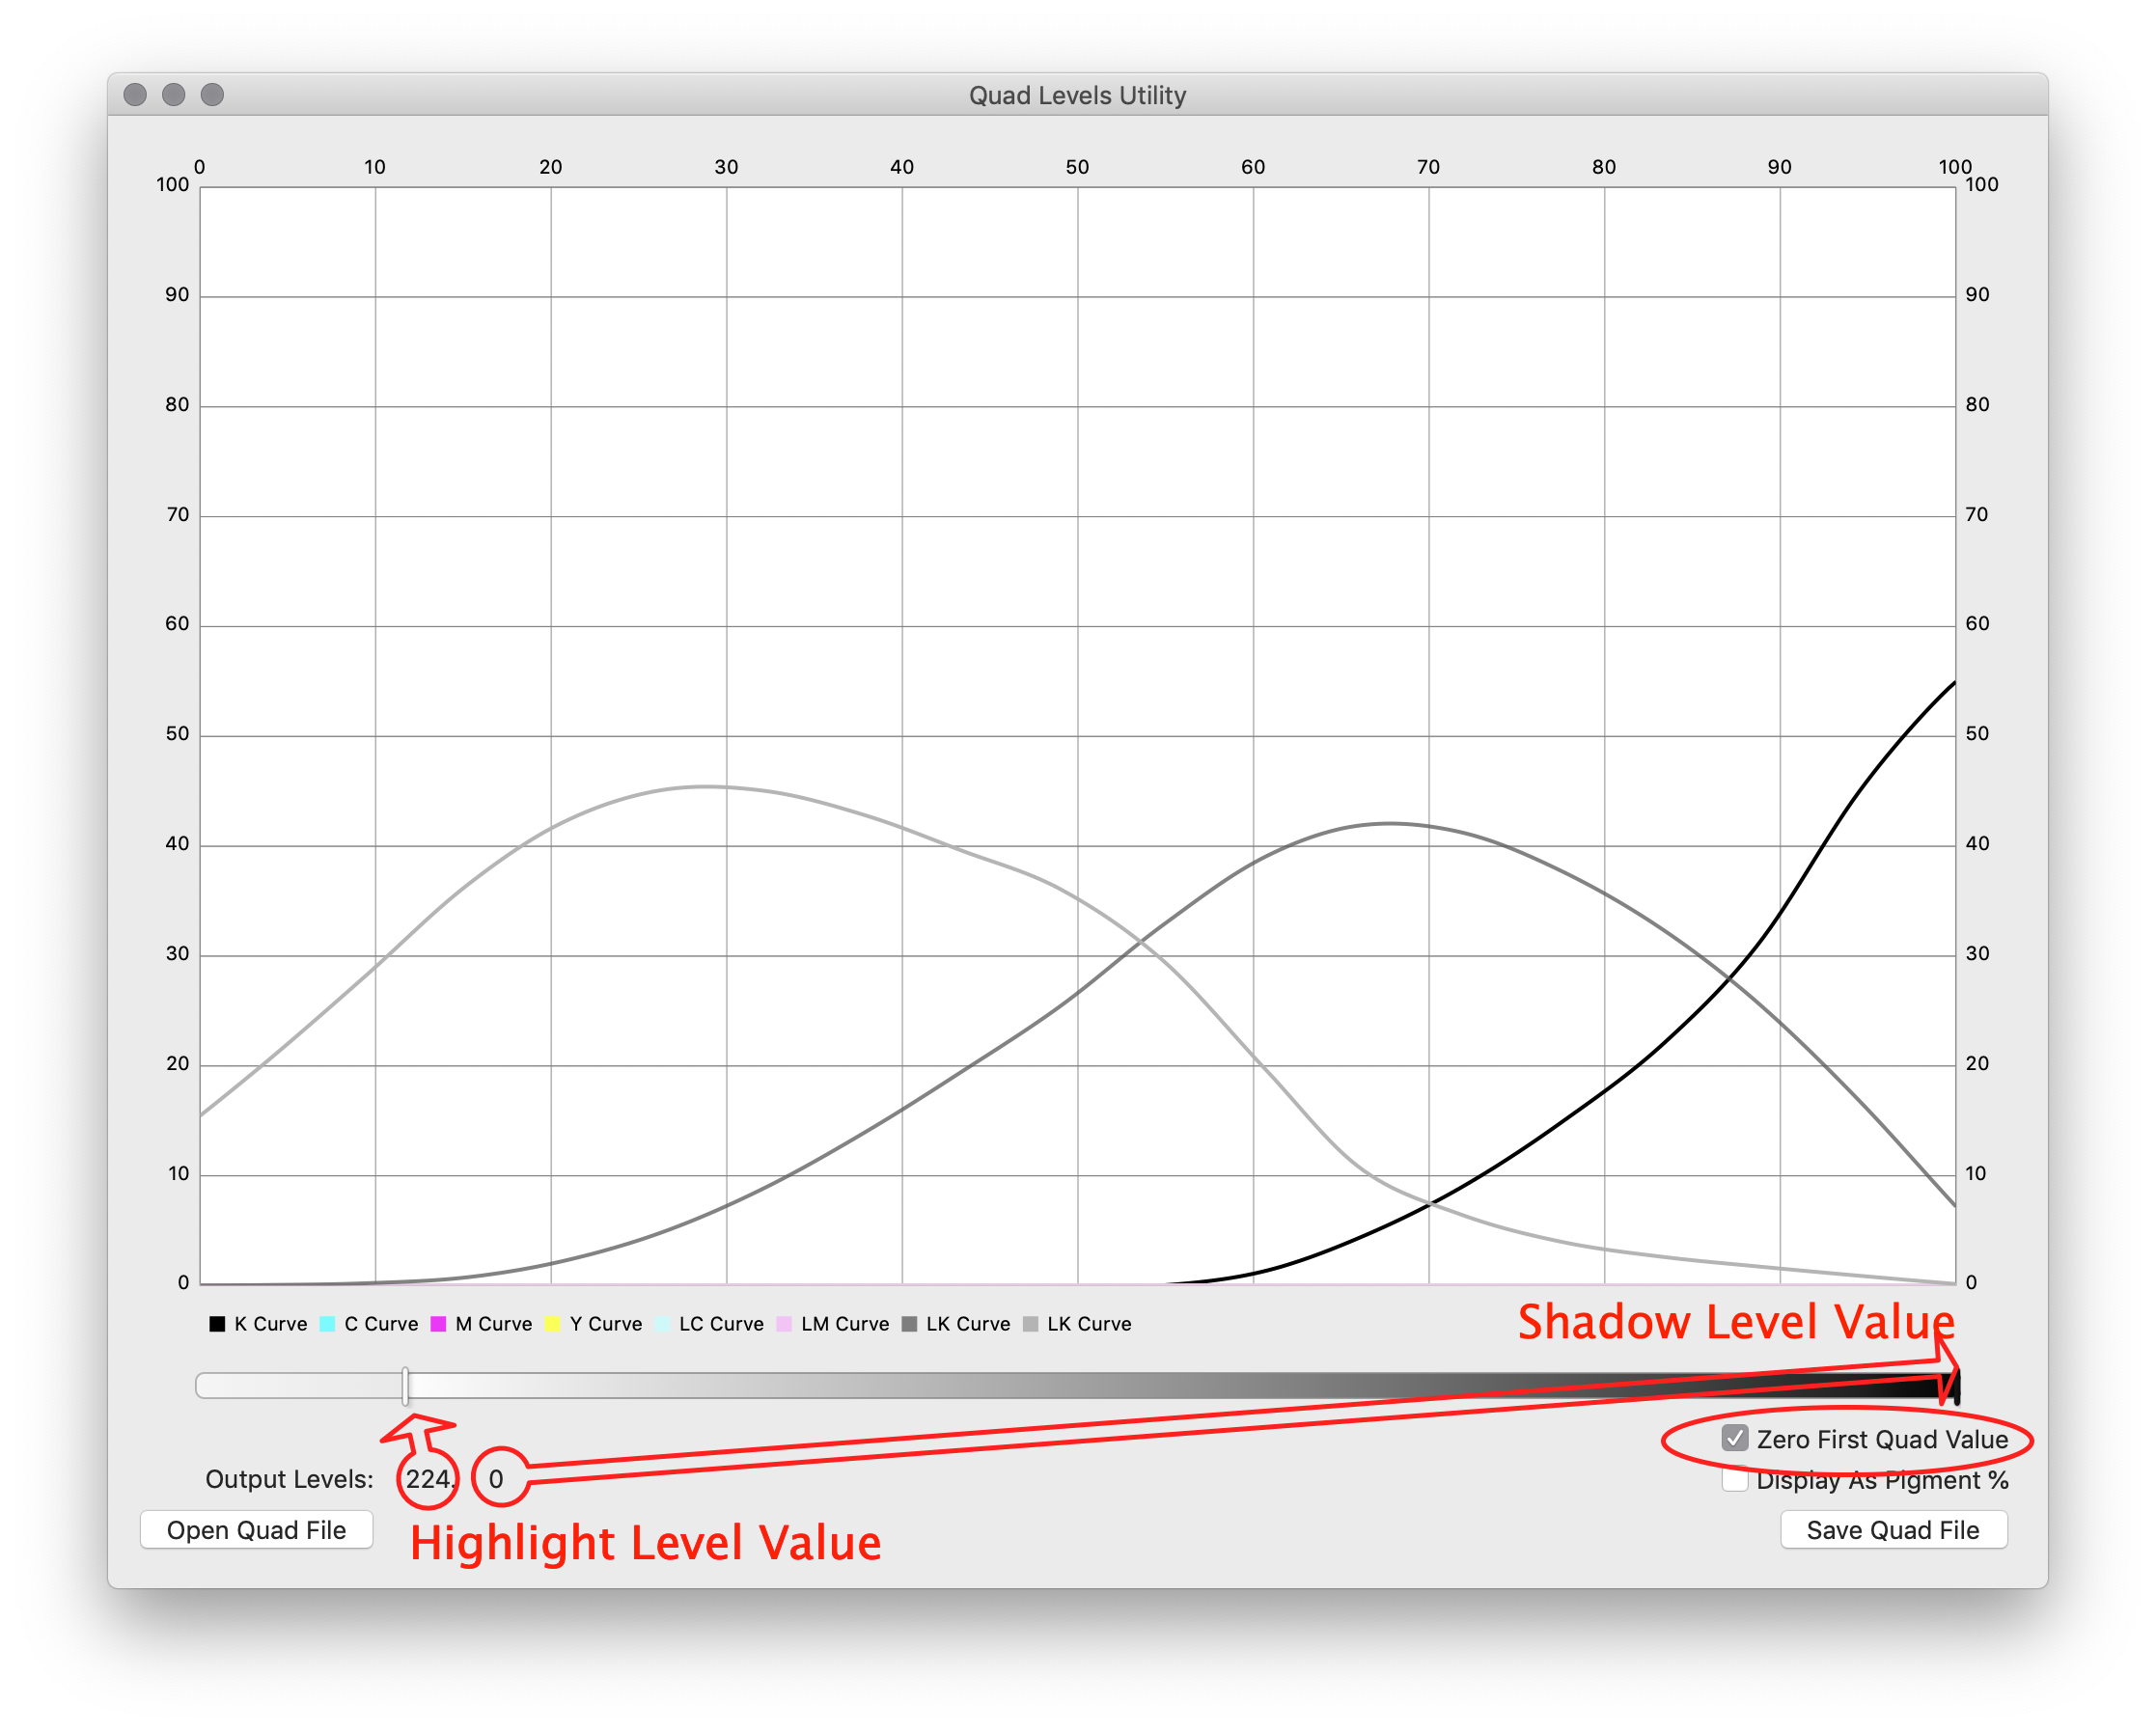
The user interface of the Quad Levels Utility is very simple and straightforward. There is an ‘open’ and ‘save’ button and two sliders to set the upper and lower limits of the quad file. There are two sliders at the bottom of this app. The left slider changes the highlight limits and the right slider changes shadow limits.
Because I chose 0 for my Shadow Level Value in this case, the right hand slider remains unchanged. Next, the left hand slider is adjusted to the appropriate Higlight Level Value, which in this case is 224.
Since the highlight level values have been adjusted to lay down ink even when the image values are 0%, there is a convenient checkbox that will override this behavior for the first gray level in the image file and write down a ‘zero’ instead. This insures that when the positive is printed that light-light-black ink is not wasted by printing the margins in a light gray. By clicking this checkbox anything at level 255 will always result in no ink being deposited on the positive.
Once these levels have been set appropriately and the zero-first-quad-value checkbox has been checked, click the Save Quad File button and save the file with a useful name that will help you remember what it is. I this example, I named my file 73SP-Limit-0-224.quad
Double click the install button and install the new limited curves.
Print the A6-StepTest.tif image with the new limited quad profile
Note that the A6-StepTest.tif image file that I have linked to is slightly different than the one that is being shown in the examples below. I modified the file to make it easier for someone to use if only a scanner and a calibrated target is available for generating the measurement files.
In PrintTool, load the A6-StepTest.tif image and print the positive using the new limited .quad file as the output ink curve.
Make a plate using the A6-StepTest image positive printed with the limited quad ink profile
Using the chosen Screen Exposure value from the first test, expose a new A6 plate with the aquatint screen. Using the same Image Exposure value used in the aquatint exposure test, expose the plate with the newly printed positive.
Etch, dry and post-exposure harden the plate. Make a print with this plate using your chosen paper and ink.
I ended up with this print that had the proper end points but blocked up shadows and overly bright highlights:
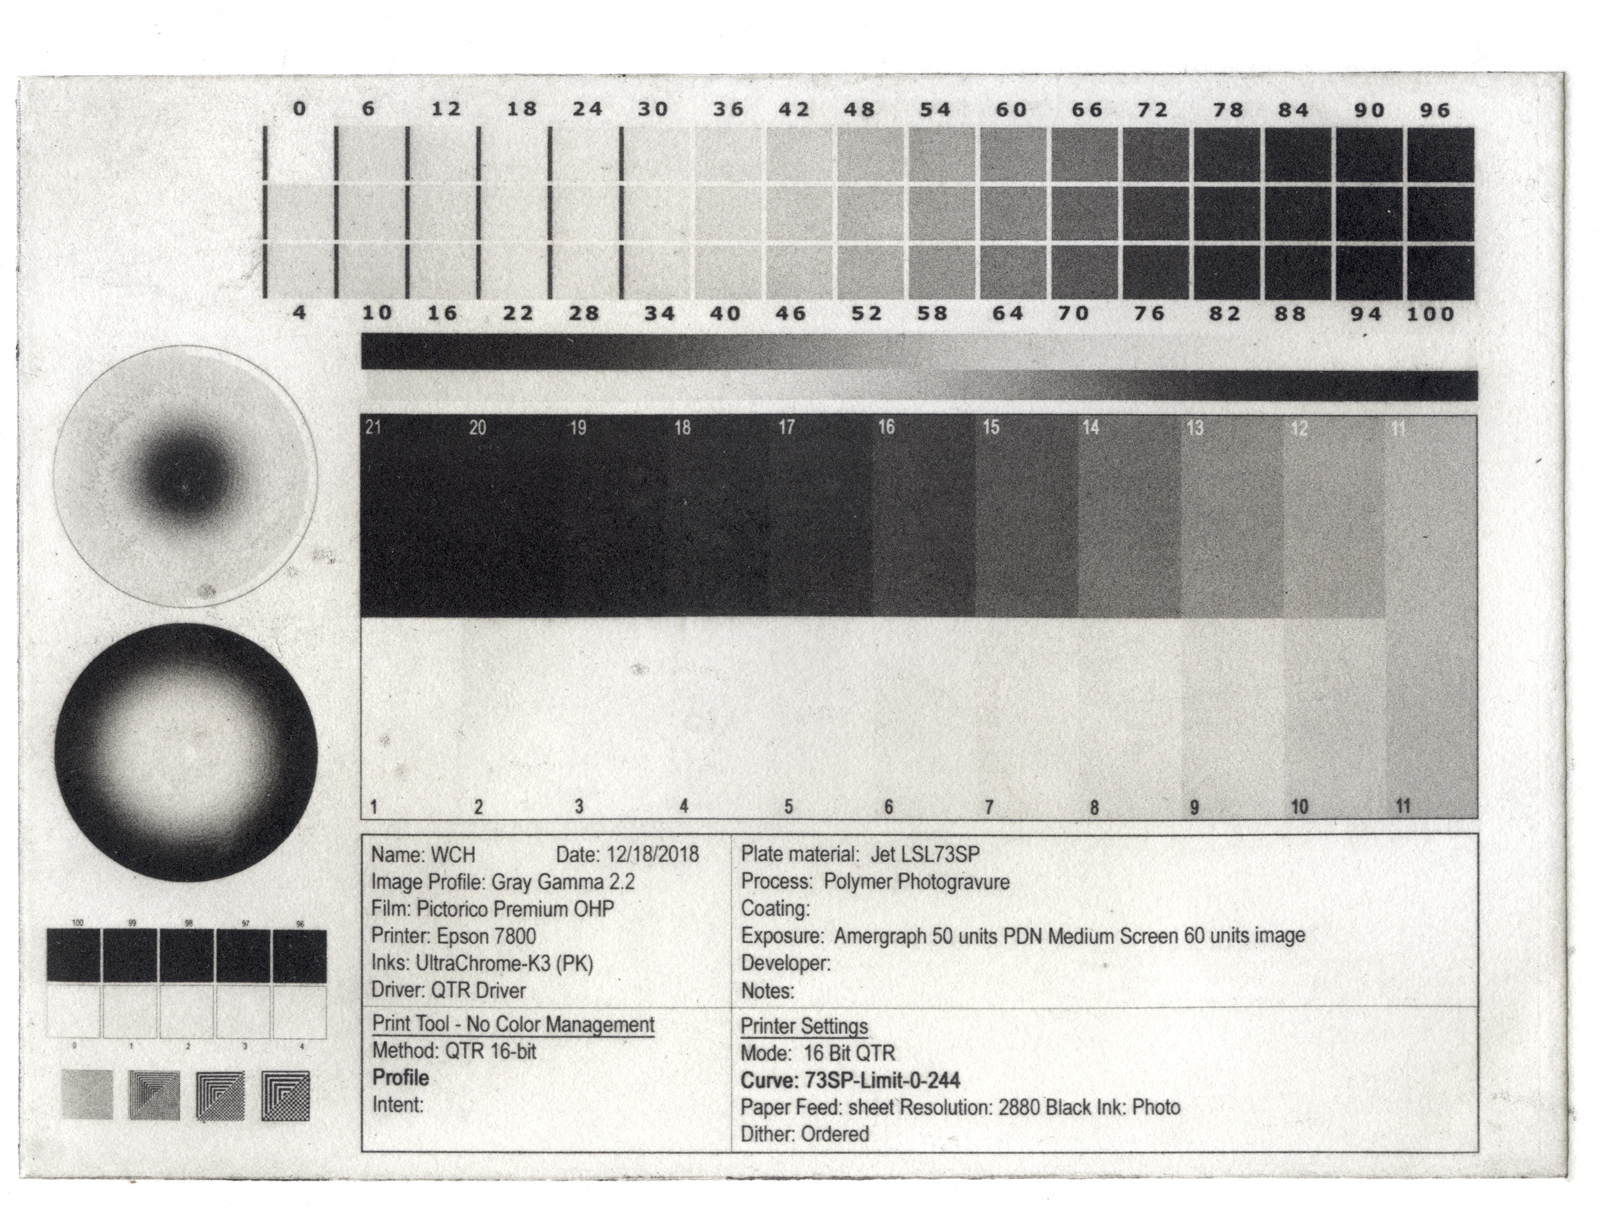
A6 Step Test printed from a positive using the levels-limited quad file. Note how the endpoints are fine but the shadows are blocked up and the highlights and midtones are too light.
Using your preferred measurement method measure the 21-step series on the test print
I use an X1-Pro2 spectrophotometer, but use whatever method you have on hand to make a measurement file that will be used to do the first pass linearization of the quad file.
The 21-step series is the first series used for the linearization. The reason for this is that step is primarily intended to make the large curve changes needed to get the steps moved close to where they should be.
Load the measurement data into QuadToneProfiler and adjust the smoothing sliders for a smooth curve
Open the QuadToneProfiler app and navigate to the Linearization tab. Click the ‘Load Measurement Data’ button and navigate and select the measurement data created in the previous step. You will see something like this:
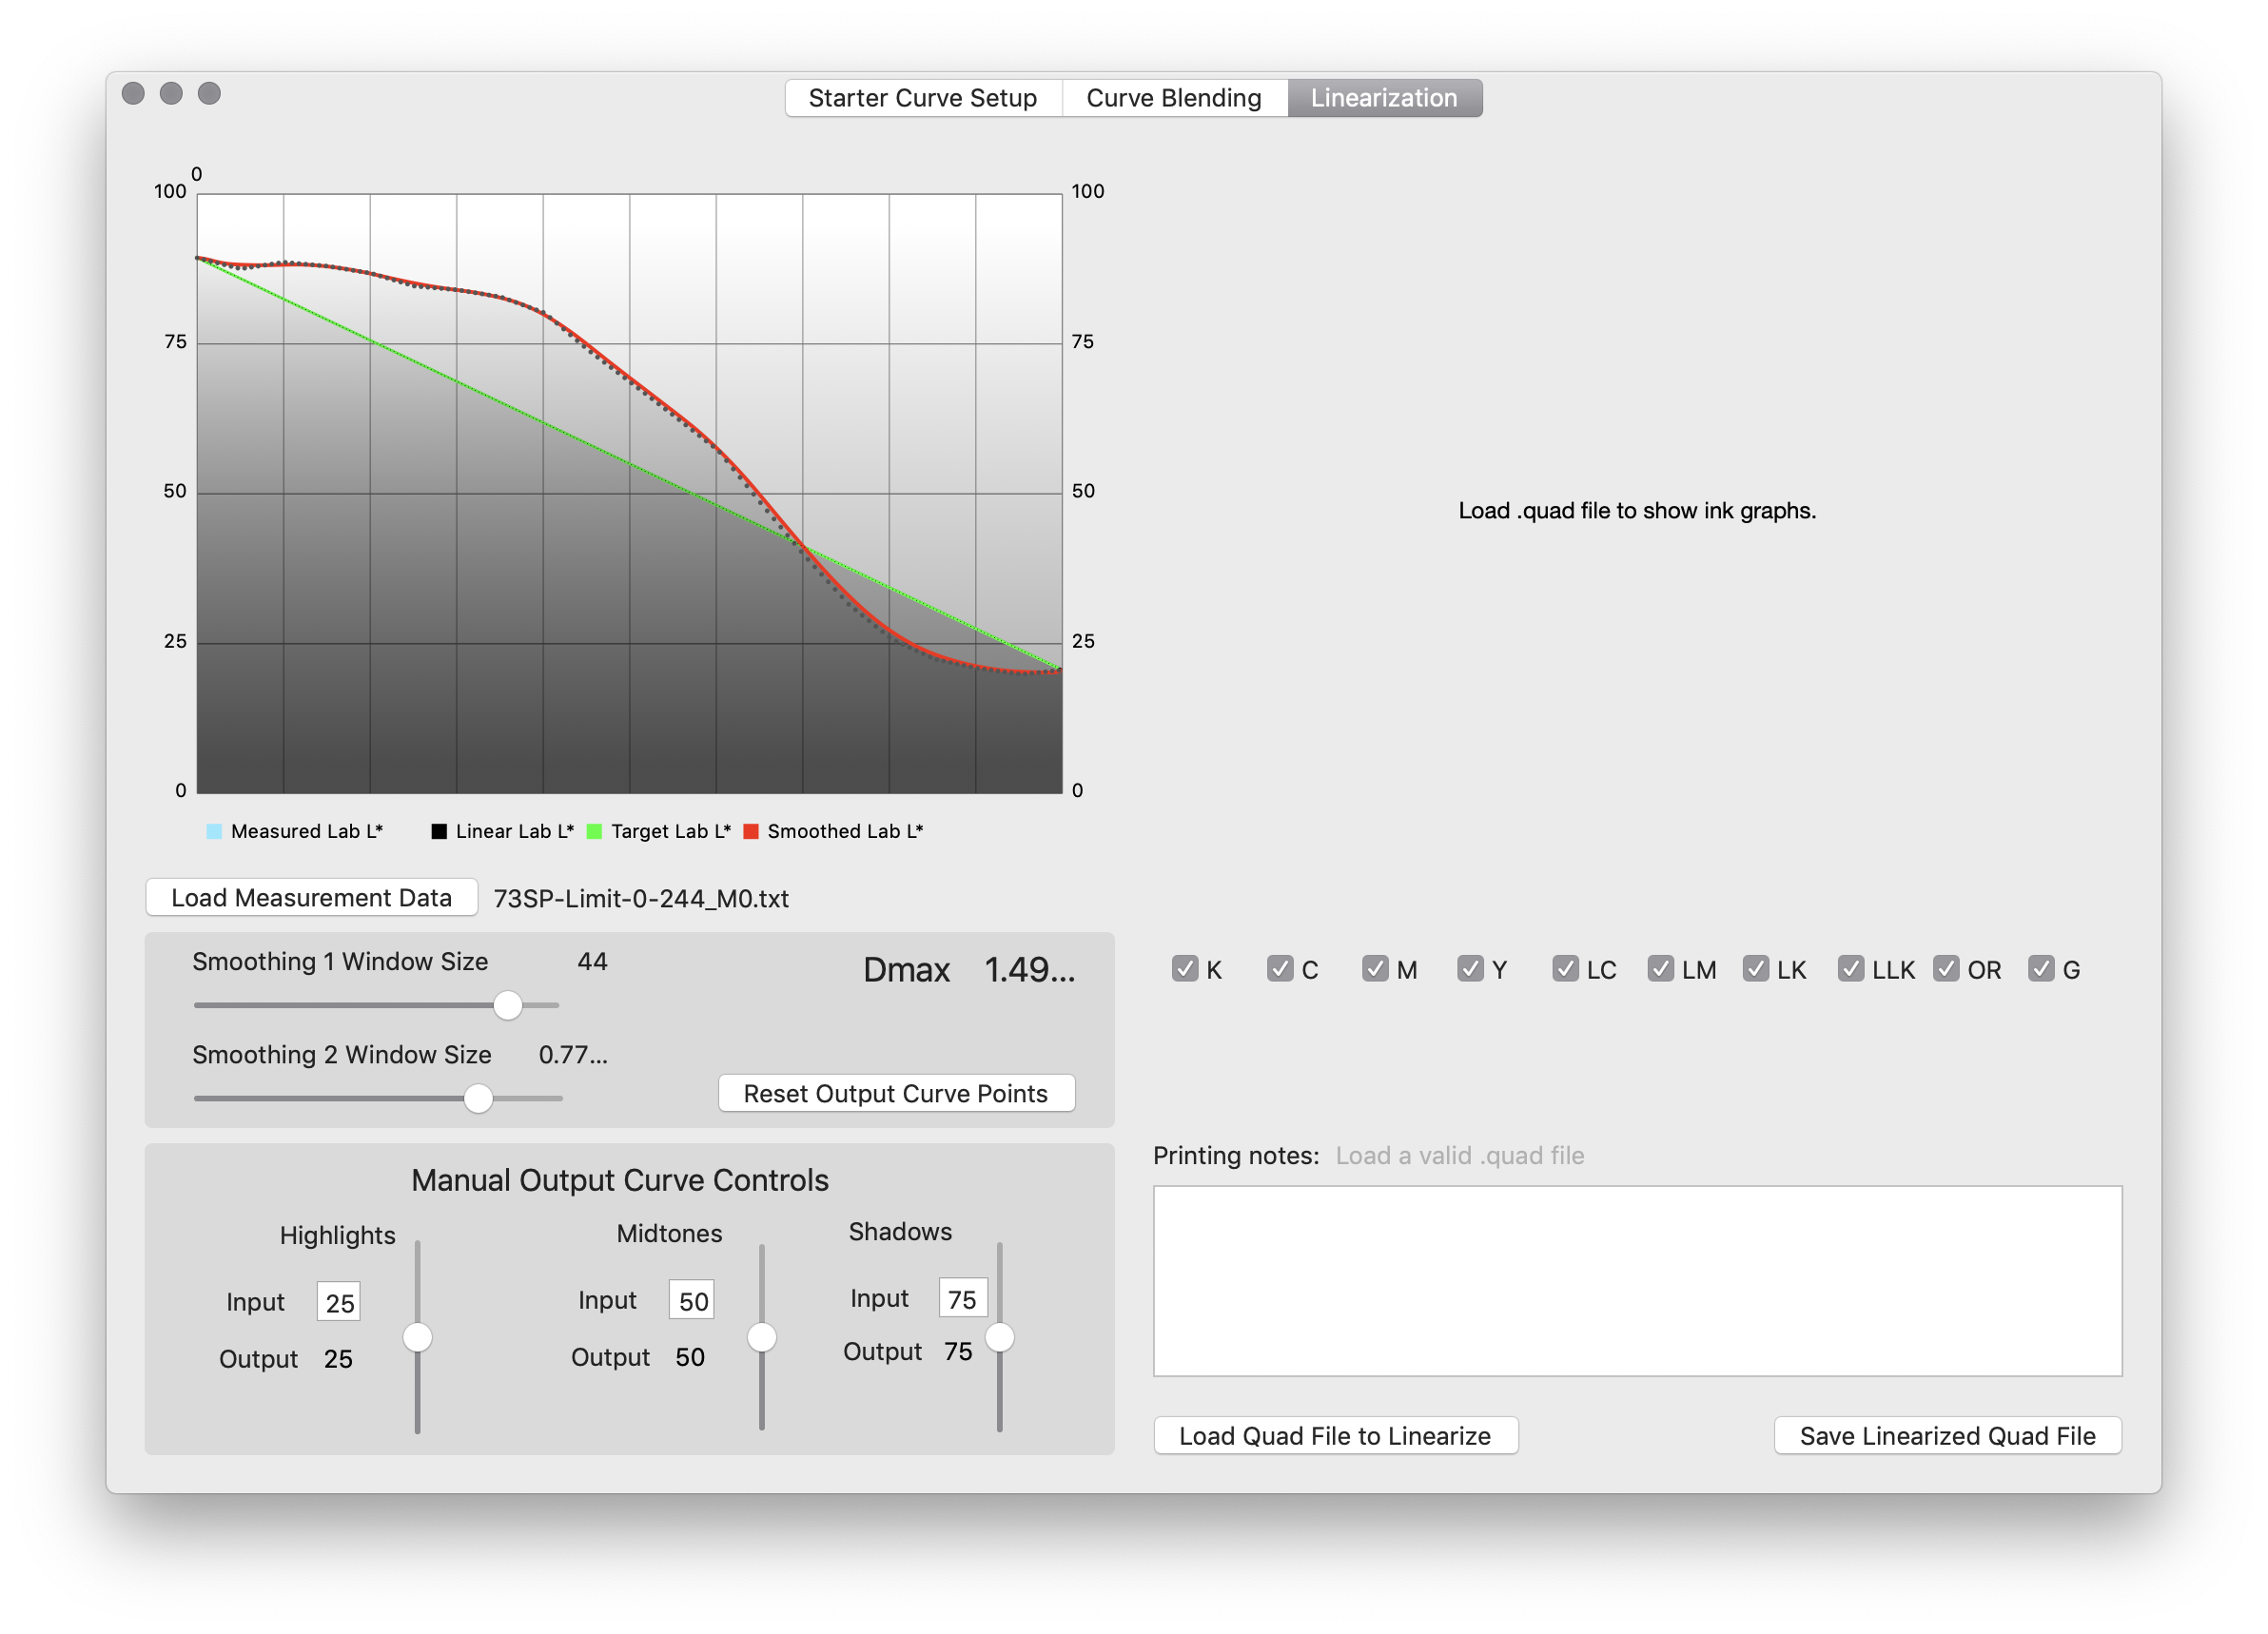
In this tab of the app, ‘Load measurement data’ is selected first, before the quad file to be linearized is loaded. Adjust the sliders until the curve is smooth. Too little adjustment will give a jagged linearized ink profile, too much won’t work as well. Season to taste, in other words.”
Adjust Smoothing 1 and Smoothing 2 sliders to create a nice smooth curve. Notice how the app shows you what your eyes have already noticed: the highlights are generally too light and the shadows are blocked up.
Now click the ‘Load Quad File to Linearize’ button, and navigate to the folder containing your quad files and select the limited quad file created previously and that was used to print the positive just measured.
You will see the inking profile window come up on the left with the ink curves with the linearization corrections applied:
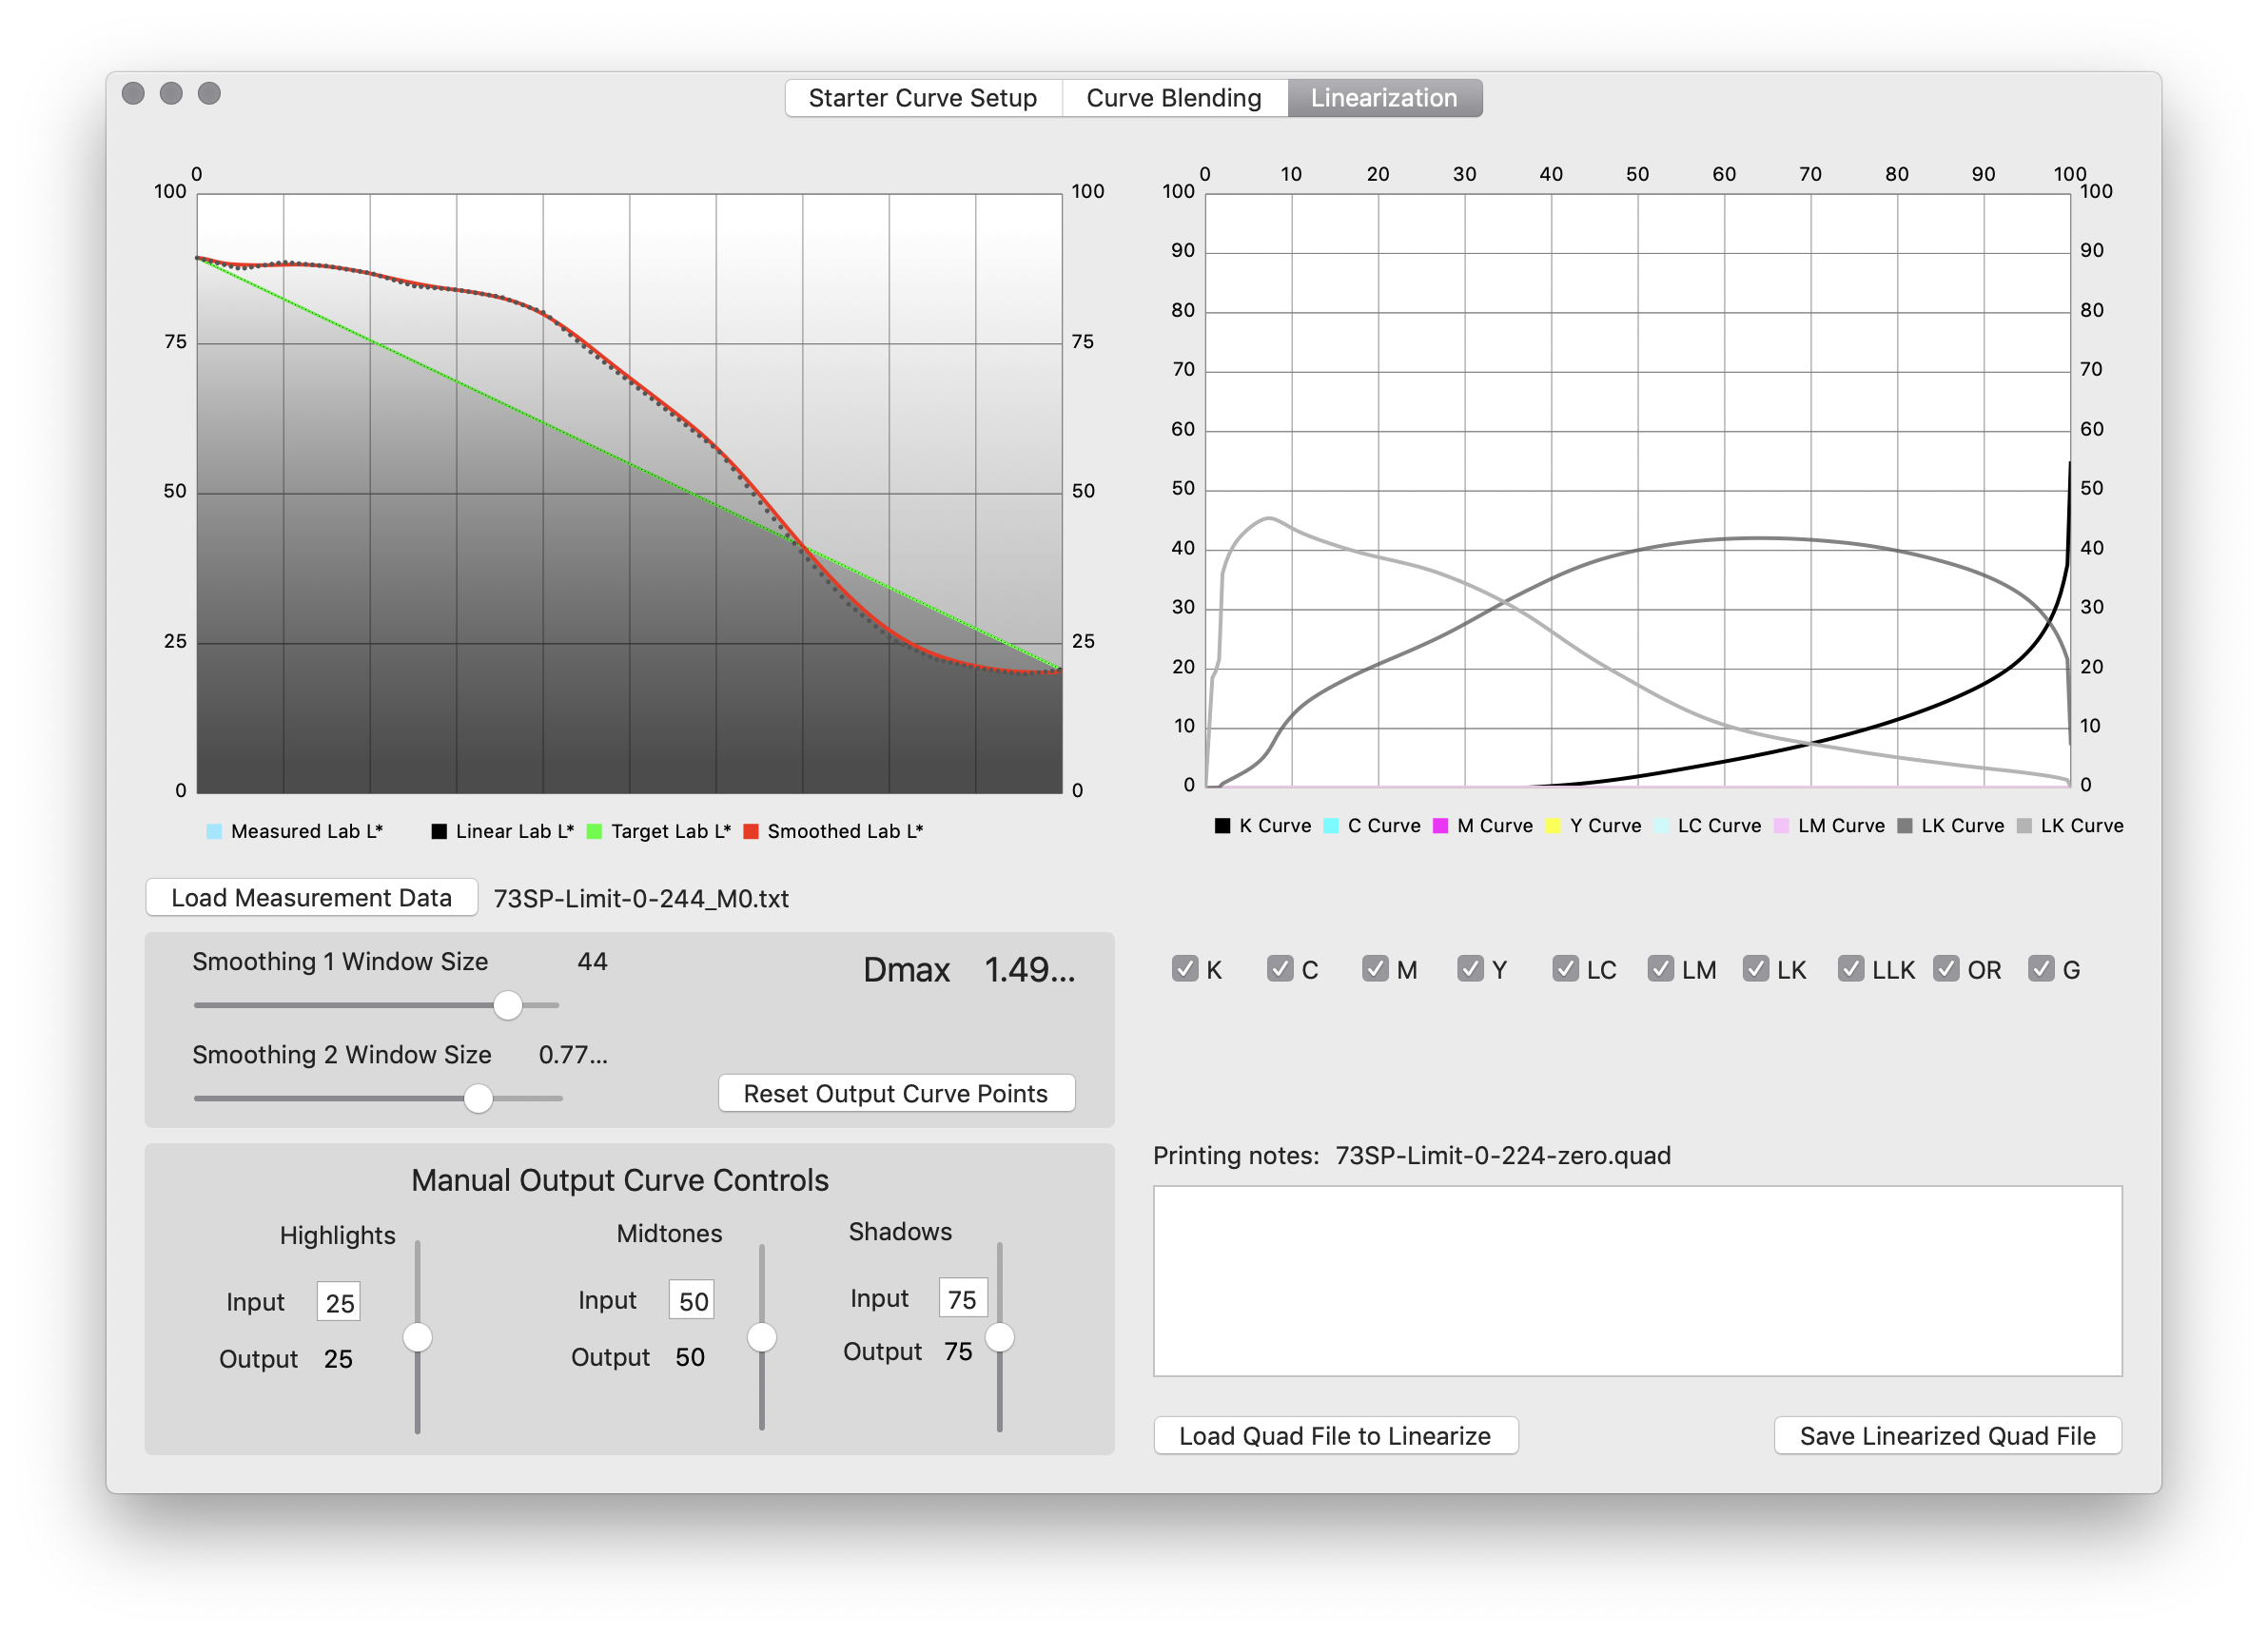
After measurement data is loaded and smoothed, the .quad file to be linearized is loaded and the modified ink curves are shown in the right pane of the app.
Click the ‘Save Linearized Quad File’ button and save your adjusted .quad file to the same location and name it something informative like 73SP-Limit-0-224-zero-Lin21.quad which tells you that this is a curve that has had limits applied, the ‘0’ first ink level has been zeroed out and a linearization applied from measuring a 21-step step tablet.
Double click the Installation script and install this new inking profile.
Print another A6-StepTest positive using the newly linearized .quad ink profile
The title explains it. Print the StepTest again with this new ink profile.
Make another plate with this new positive
Thoroughly dry the positive and make another plate, keeping aquatint and image exposure values identical to the previous test.
Make another print using this plate.
Measure the print made with the 21-step linearization profile using the 51 step values
Chances are this print is already better than you could have gotten with several days of fiddling with photoshop curves. In my case it looks like this:
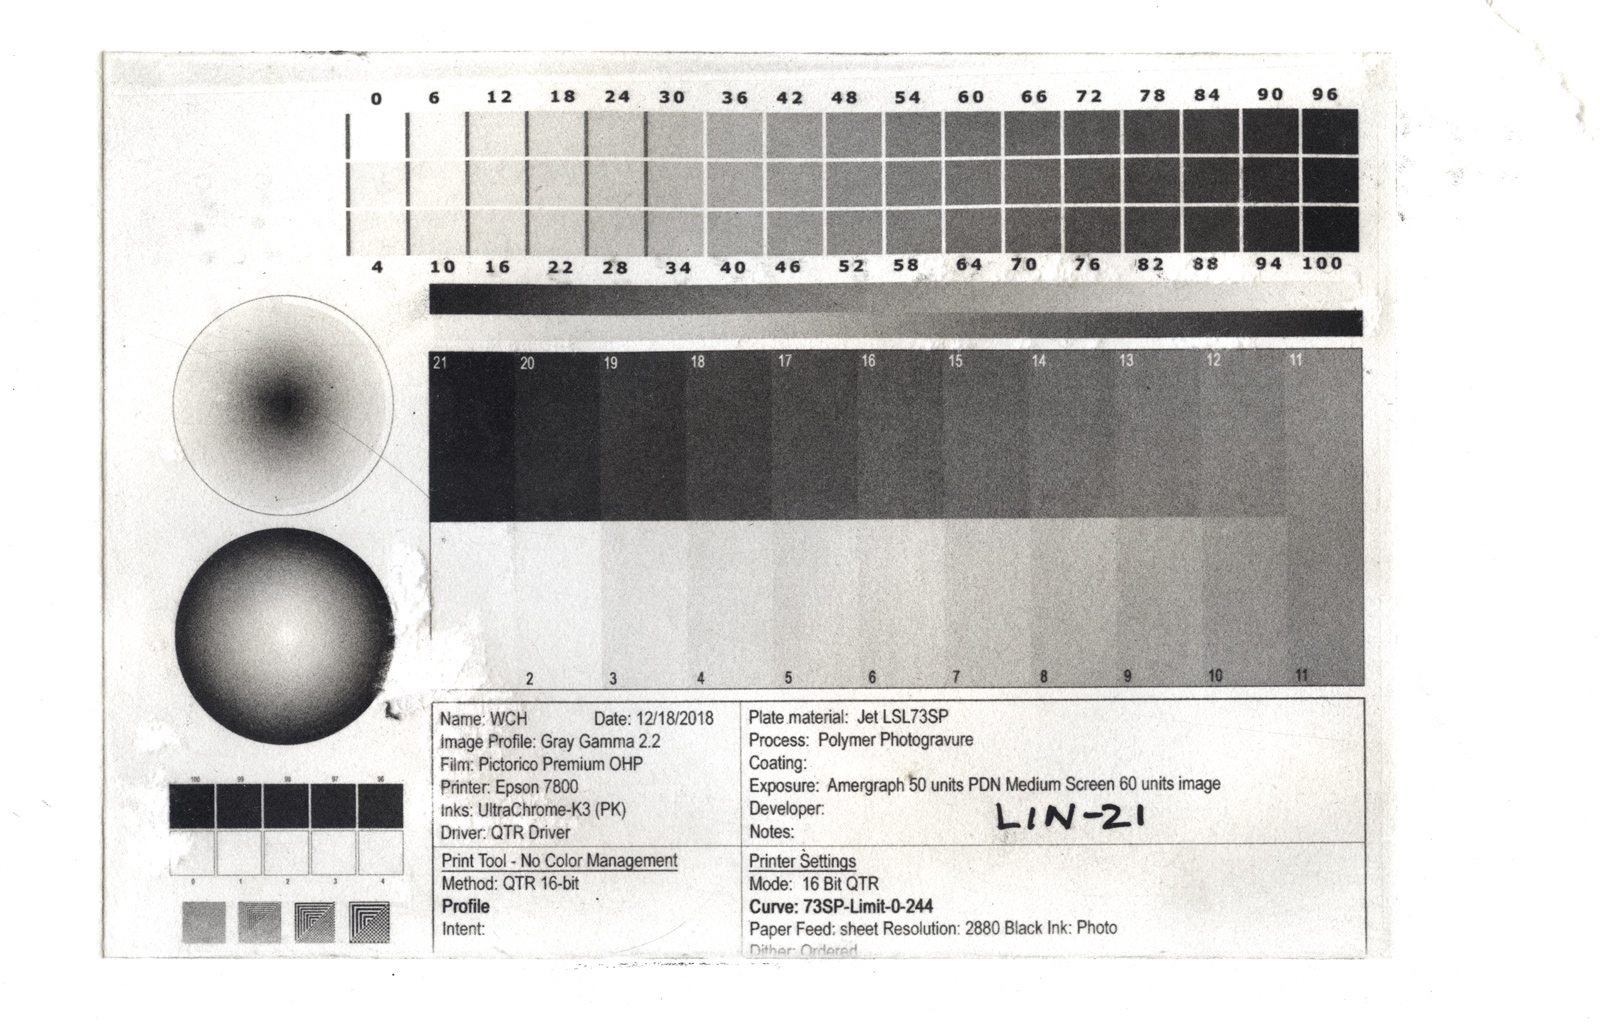
Scan of a test wedge made after linearizing the starter .quad file with the 21-step measurement values.
You can quit here and start printing, or you can go for gold and make measurements on the 51-step series and fine-tune the linearization.
Measure the 51 step series and make a new measurement file
Measure the 51 step series and save the measurements to a file. Using the QuadToneProfiler app and the Linearization tab, load the 51 step measurements and check how well the 21 step linearization worked. In this example I saw this:
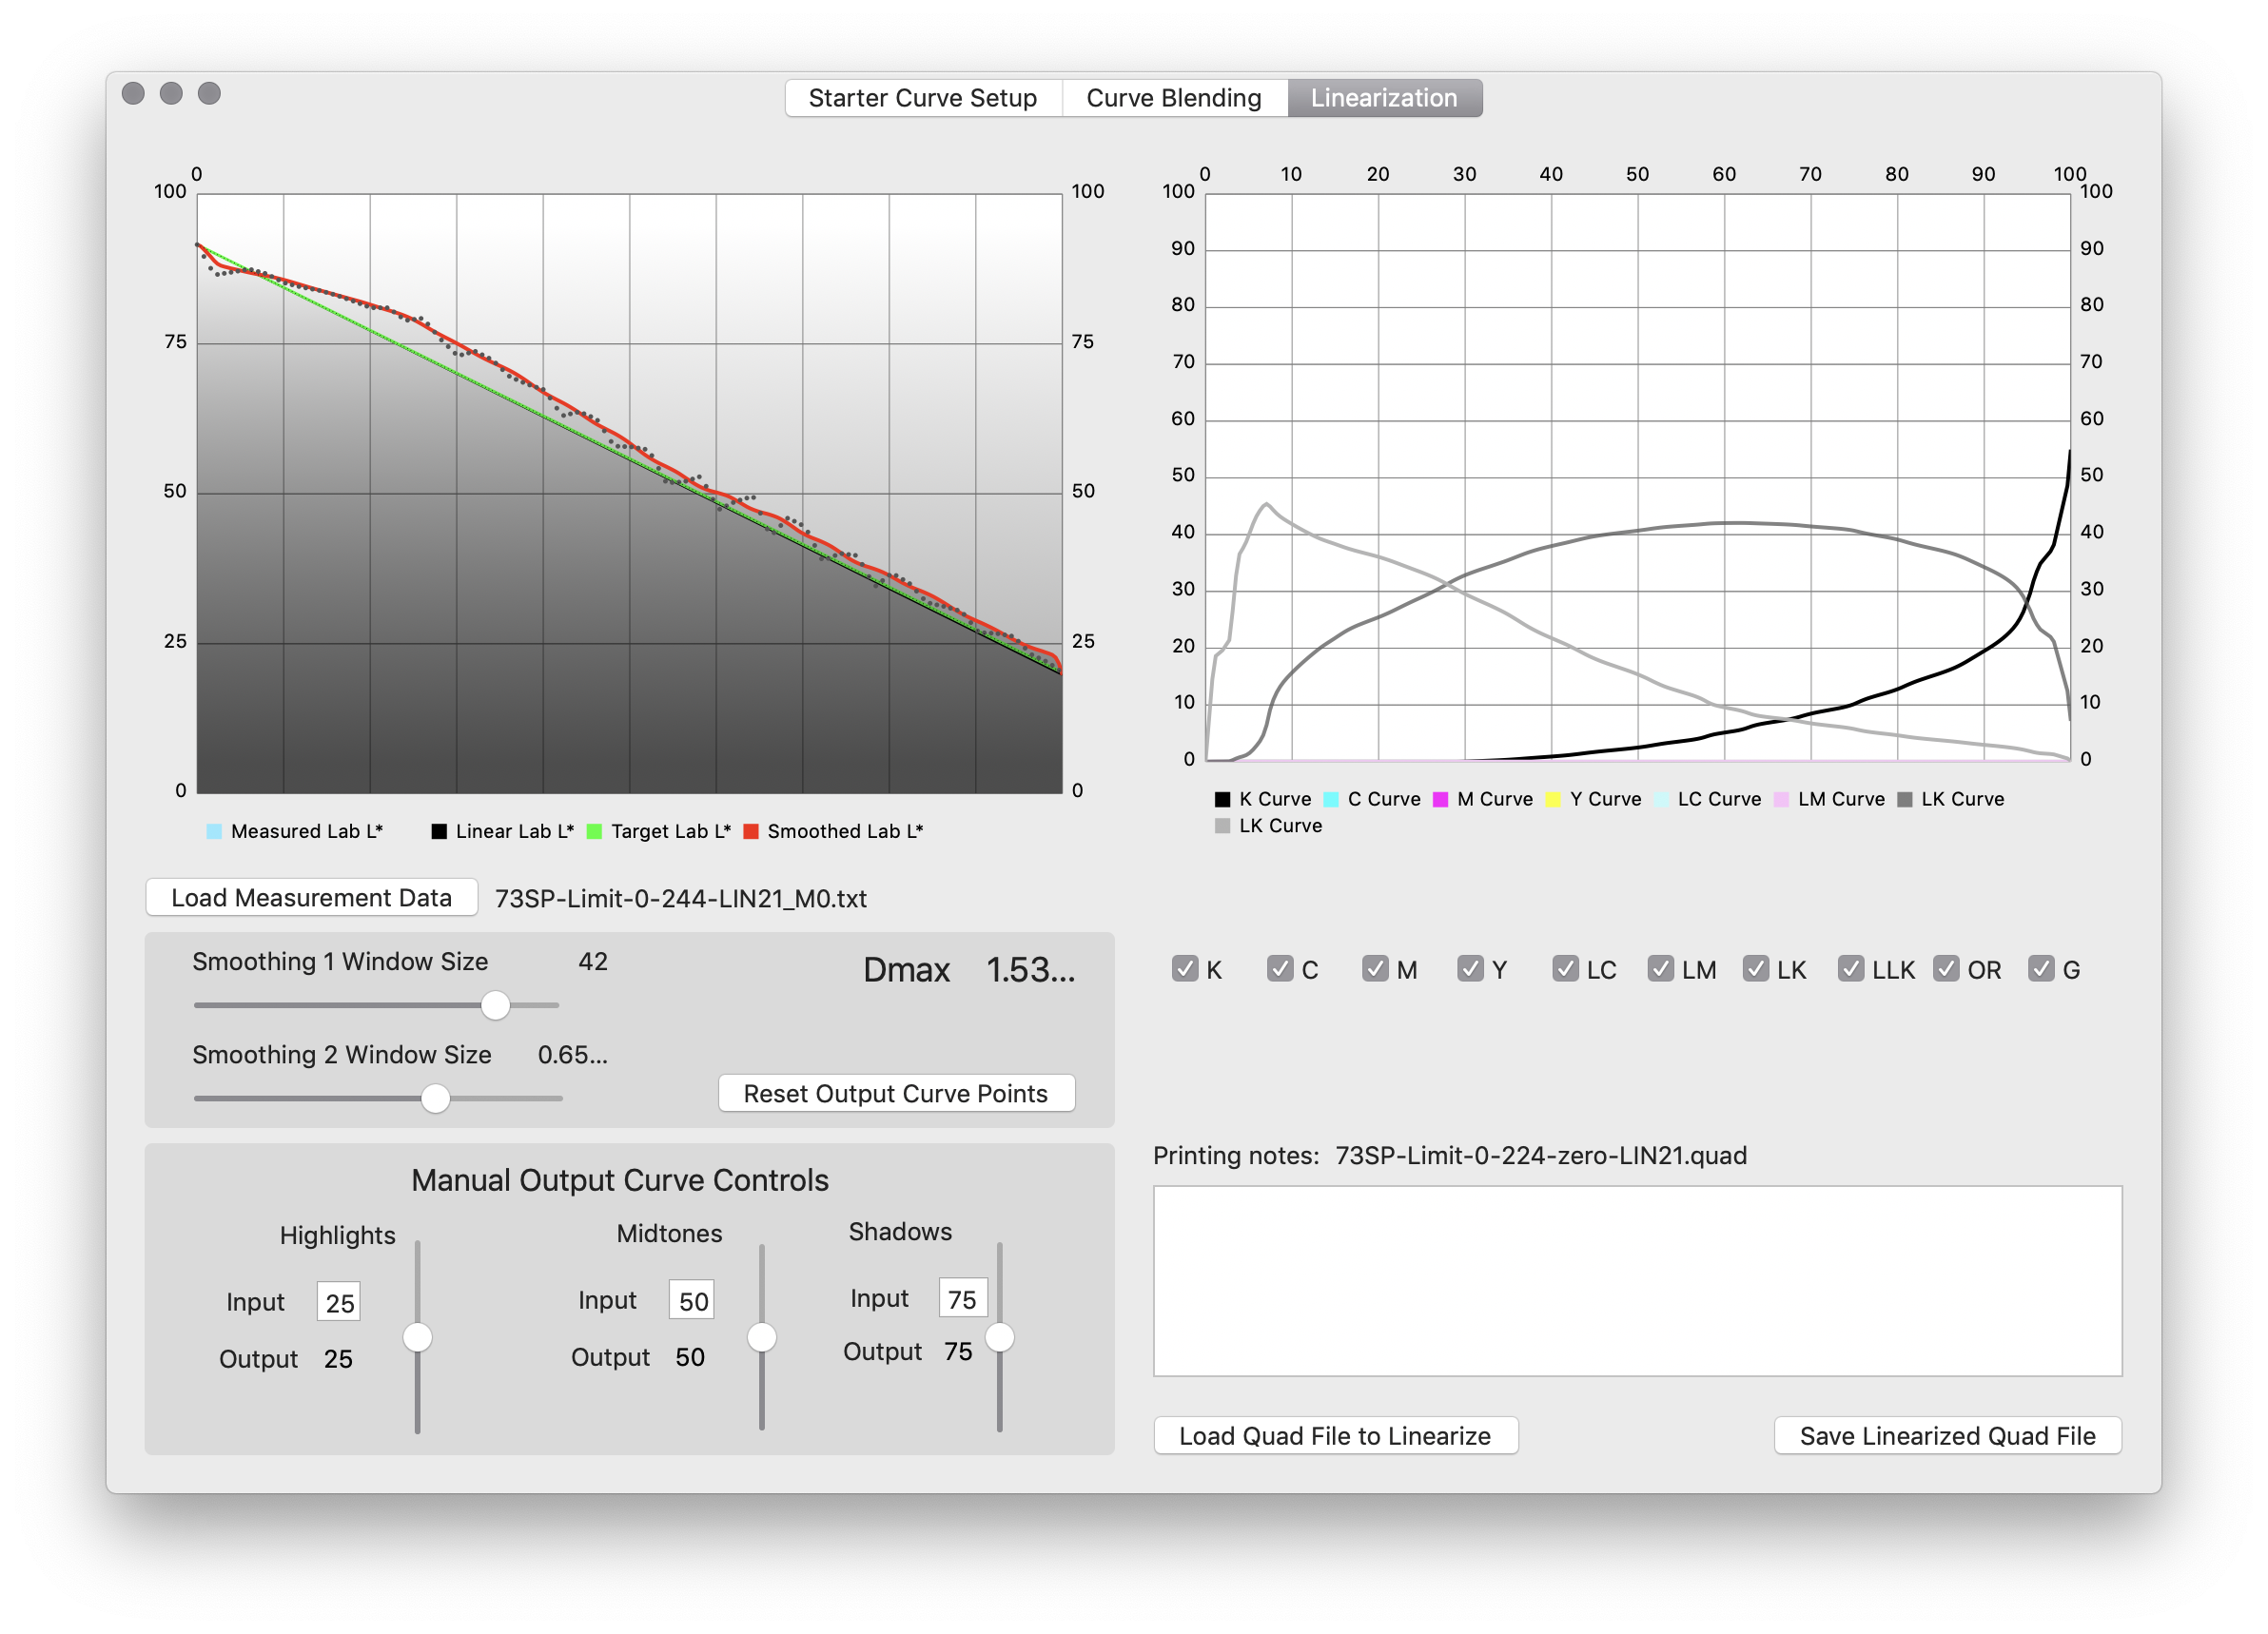
Measure the 51-step series output from the 21-step quad linearization and check how close to linear is the result. In this case the highlights were still a little off, so the 21-step .quad was loaded and linearized with the measurements from the 51-step series.” %}
It is amazingly close, but the highlights are still a little lighter than I would like.
Adjust the smoothing sliders and save the resulting adjusted quad with a different name, such as 73SP-Limit-0-224-zero-LIN51.quad
Print the A6-StepTest using the 51-step linearized quad file
Make another positive using this newly adjusted quad file and make another plate. Keep exposure values the same throughout the testing. Make a print using this plate.
I ended up with this:
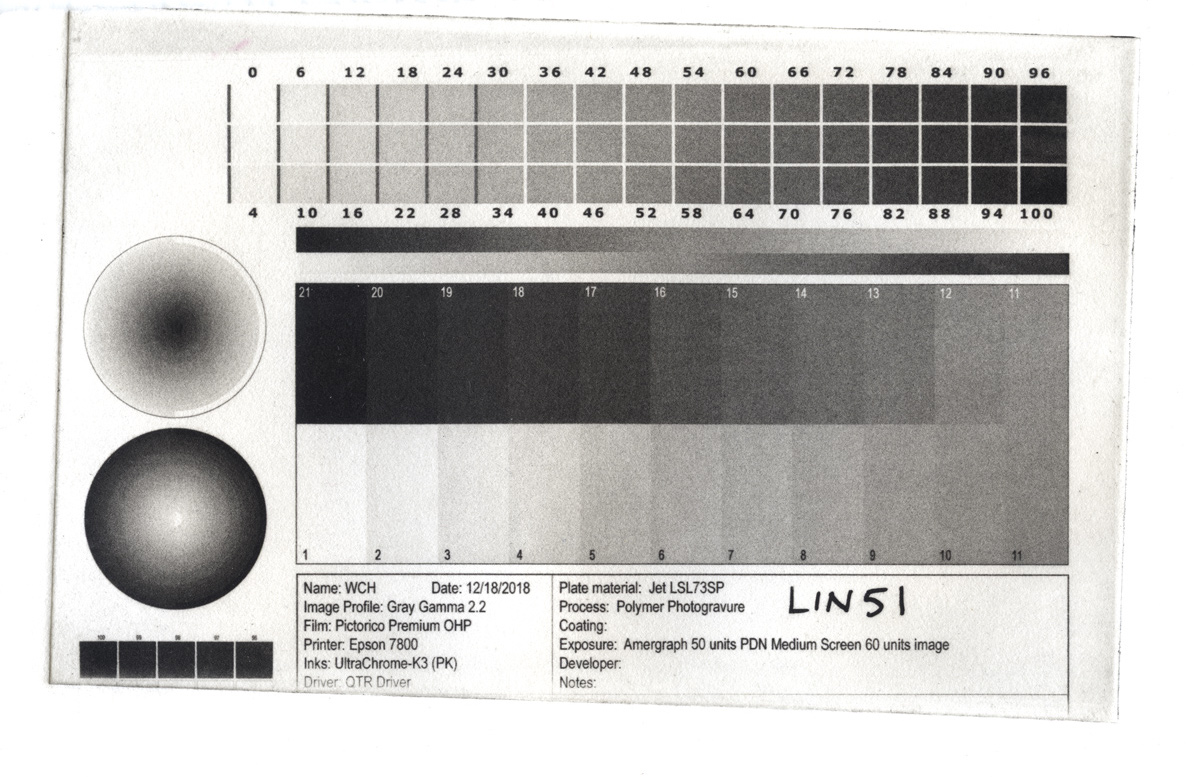
The scanned stepwedge made from the positive that used the 51-step linearization data for correcting the curves. This is far closer to perfection after just two iterations than any other technique I have tried.
The changes are subtle but definitely there.
Check your results by measuring the 51-step series on the printed step wedge
Measure the 51 step values on this new print and open them in the linearization tab of the QuadToneProfiler app:
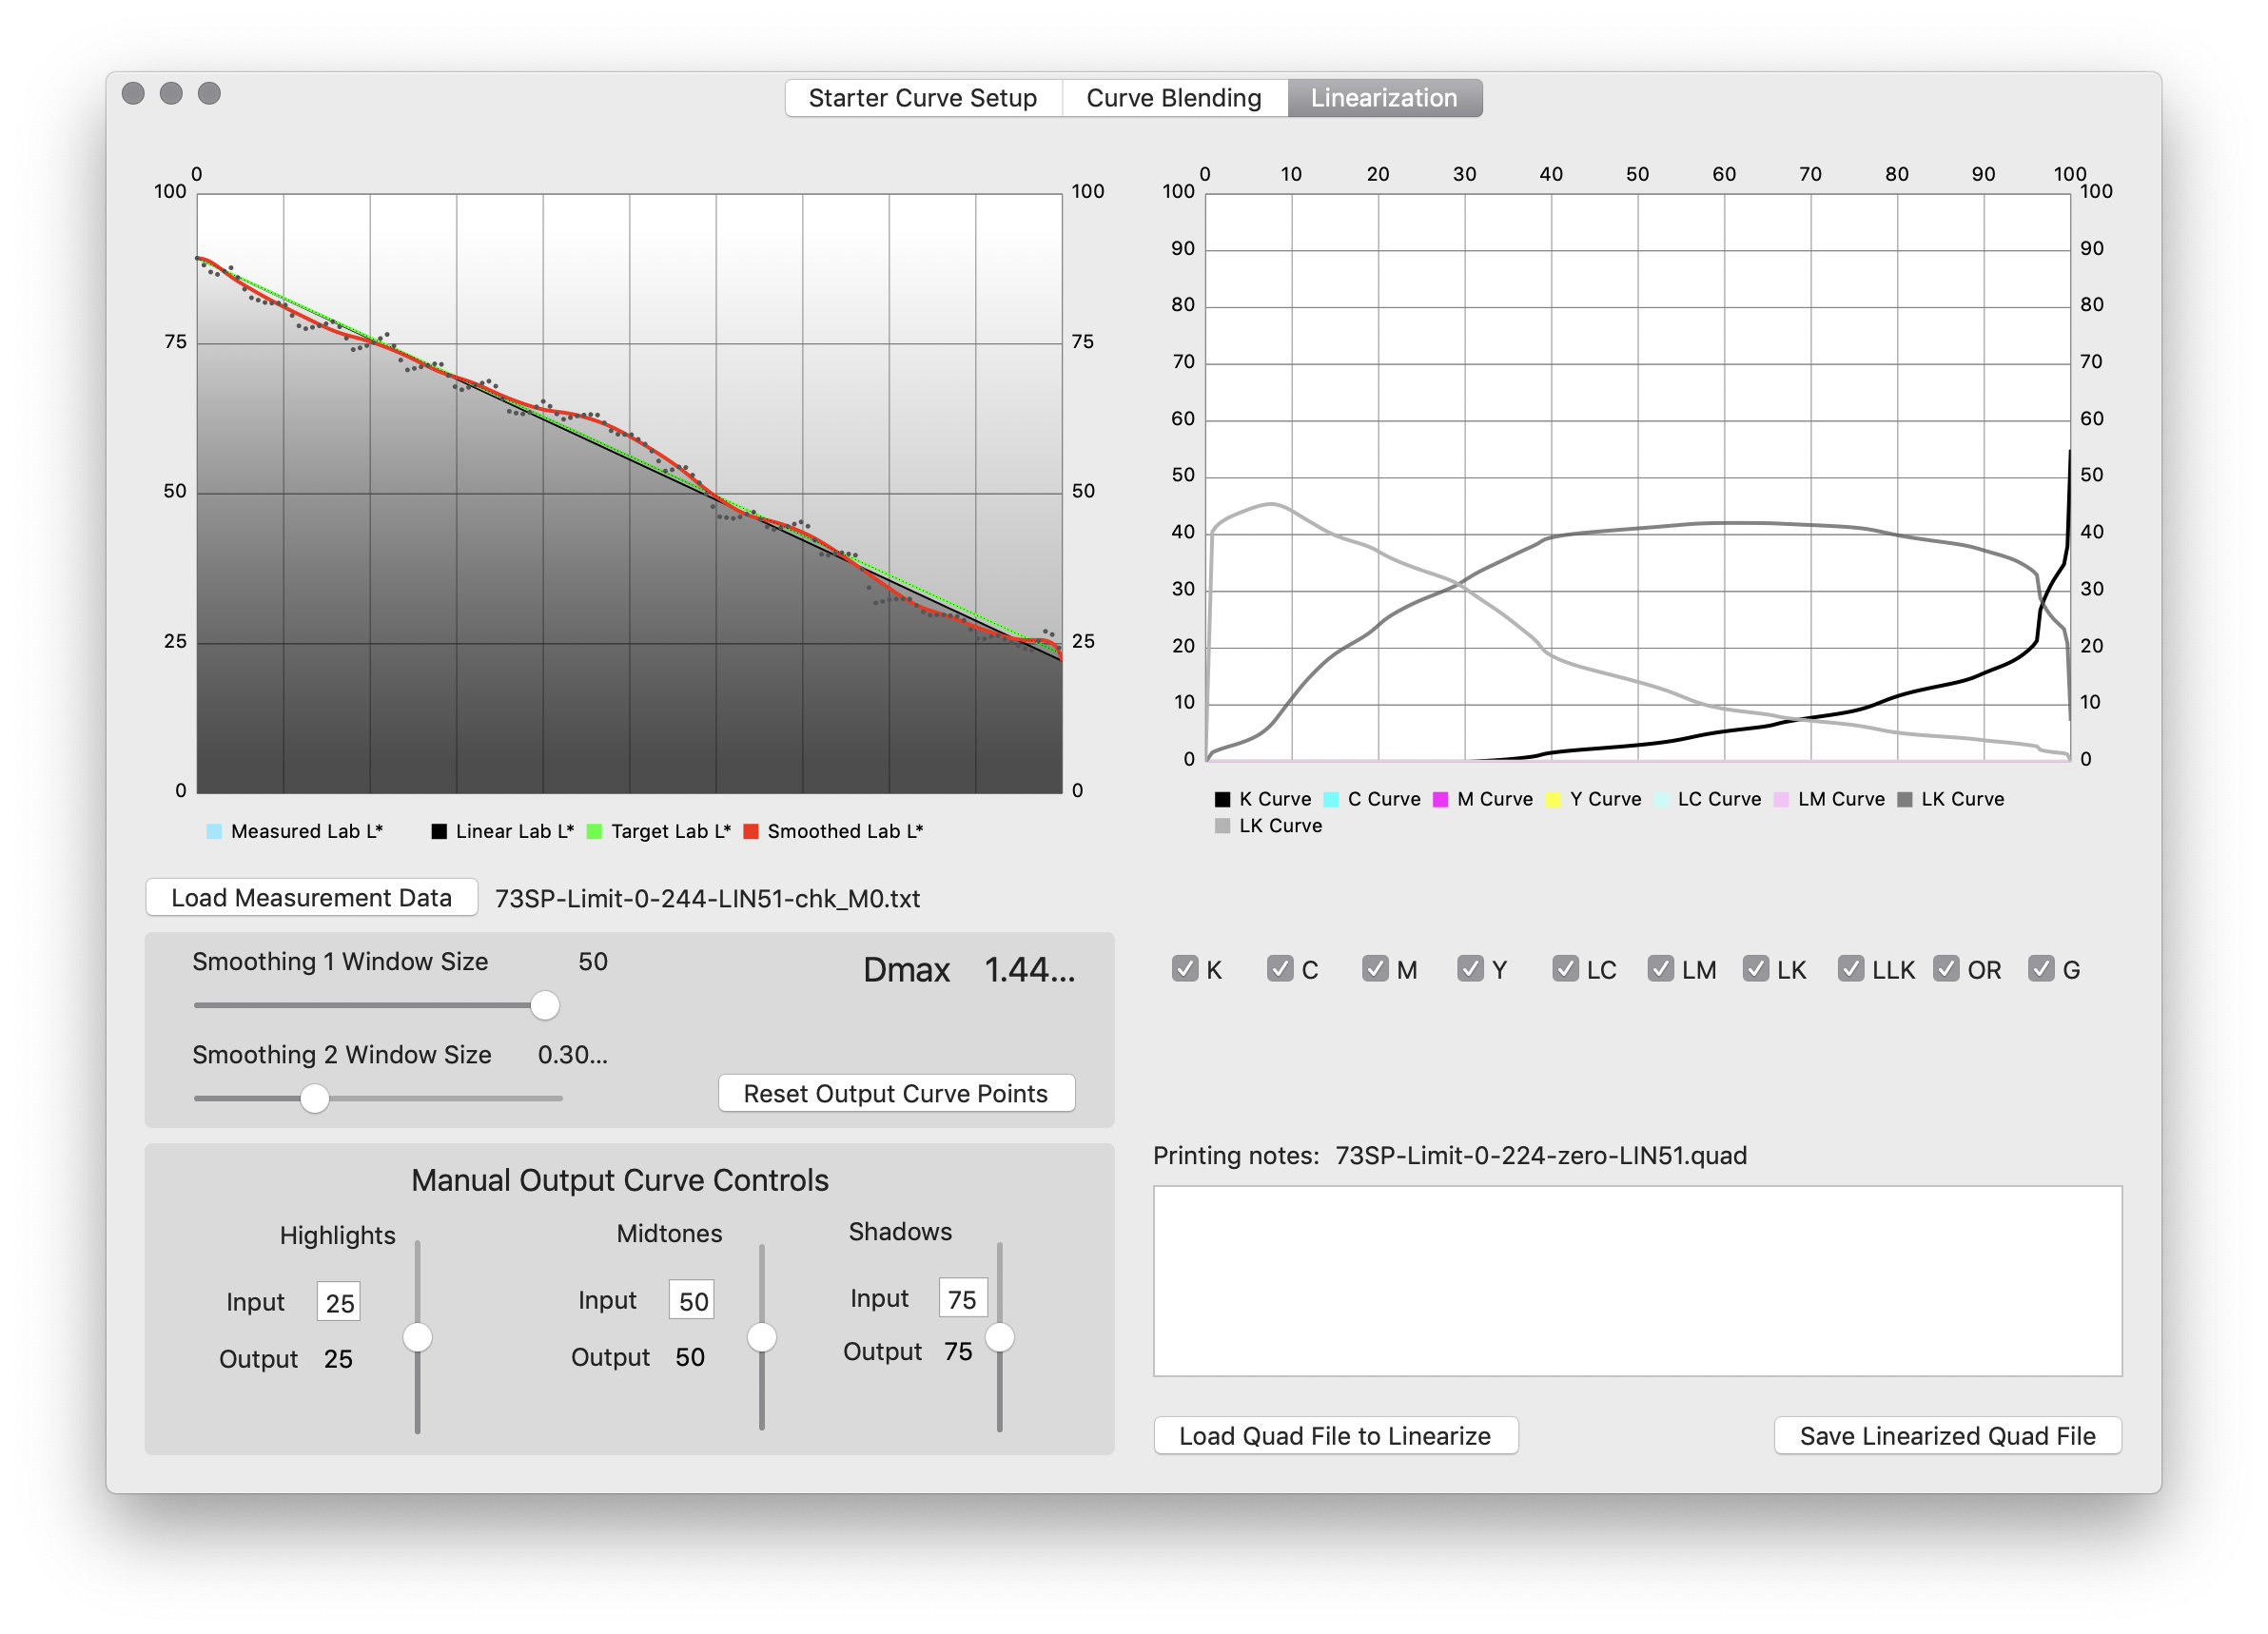
The visual results of the second linearization were quite good, but it is always wise to measure the output and check it using the QuadToneProfiler app. In this case, the result is close to dead-flat linear except for a slight bump in the midtones. This could be inking and wiping variations, or might demand one more iteration of linearization.
I am happy with the results of this second linearization. The linearization routine has produced results that fall well within the variations encountered in inking and wiping!
Iterate the steps if needed
However, if you still see bumps or weirdness, this process can be interated many times, each time loading the previous quad file to linearize and the applying the measured output from that same step to create a new quad file.
Make a test print of an actual image
The final step is to use PrintTool to make a test print of one of your own images that show a good range of both shadow and highlight detail.
We also have an option at this point. Up to now, we have been printing with ‘No Color Management’ selected in the PrintTool Print Color Management pane. Another option is to print using Print Tool Managed color and selecting Adobe RGB 1998 Gamma 2.2 output as the printing profile and using Perceptual Intent. This will subtly boost the shadow and highlight contrast and will likely more closely match what you perceive on the monitor.
Here is a print made with No Color Management:
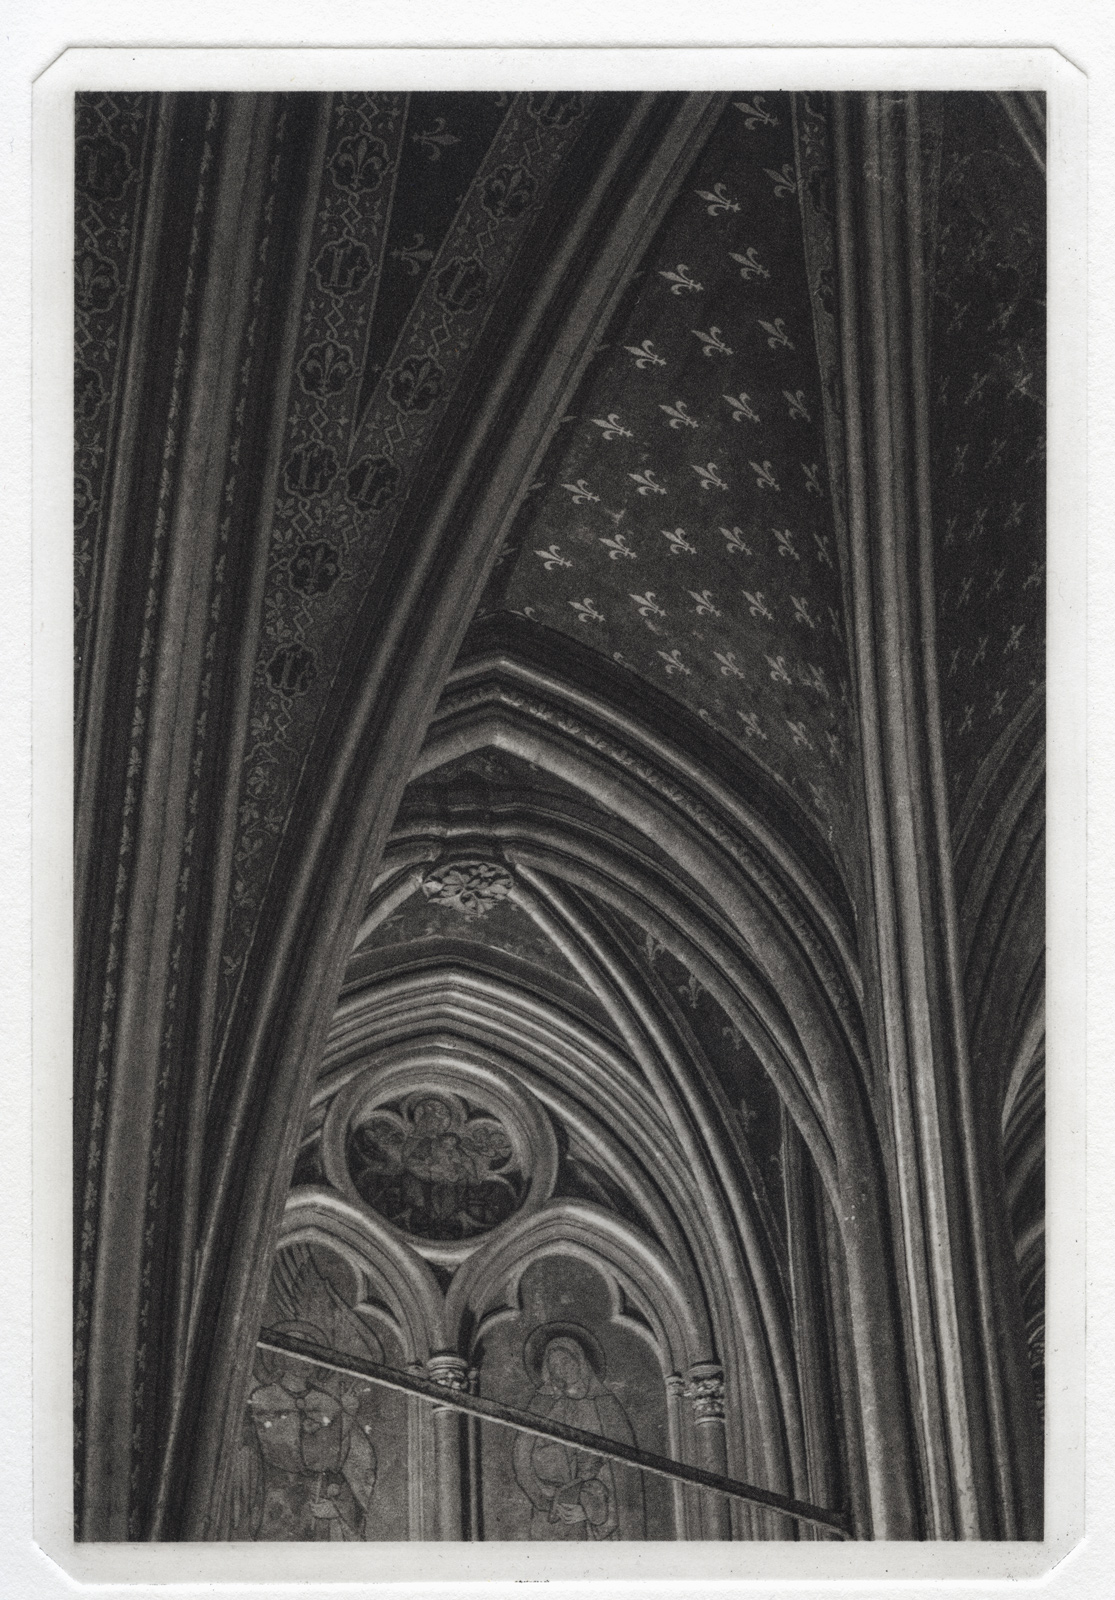
This test image was printed using the 51-step calibration ink profile and No Color Management selected in the PrintTool Color Management Pane. Compare to the image below, especially in the dark tonal areas.
And here is one made with Print Tool Managed color and Adobe 1998 and Perceptual Intent selected as an output profile and output parameter.
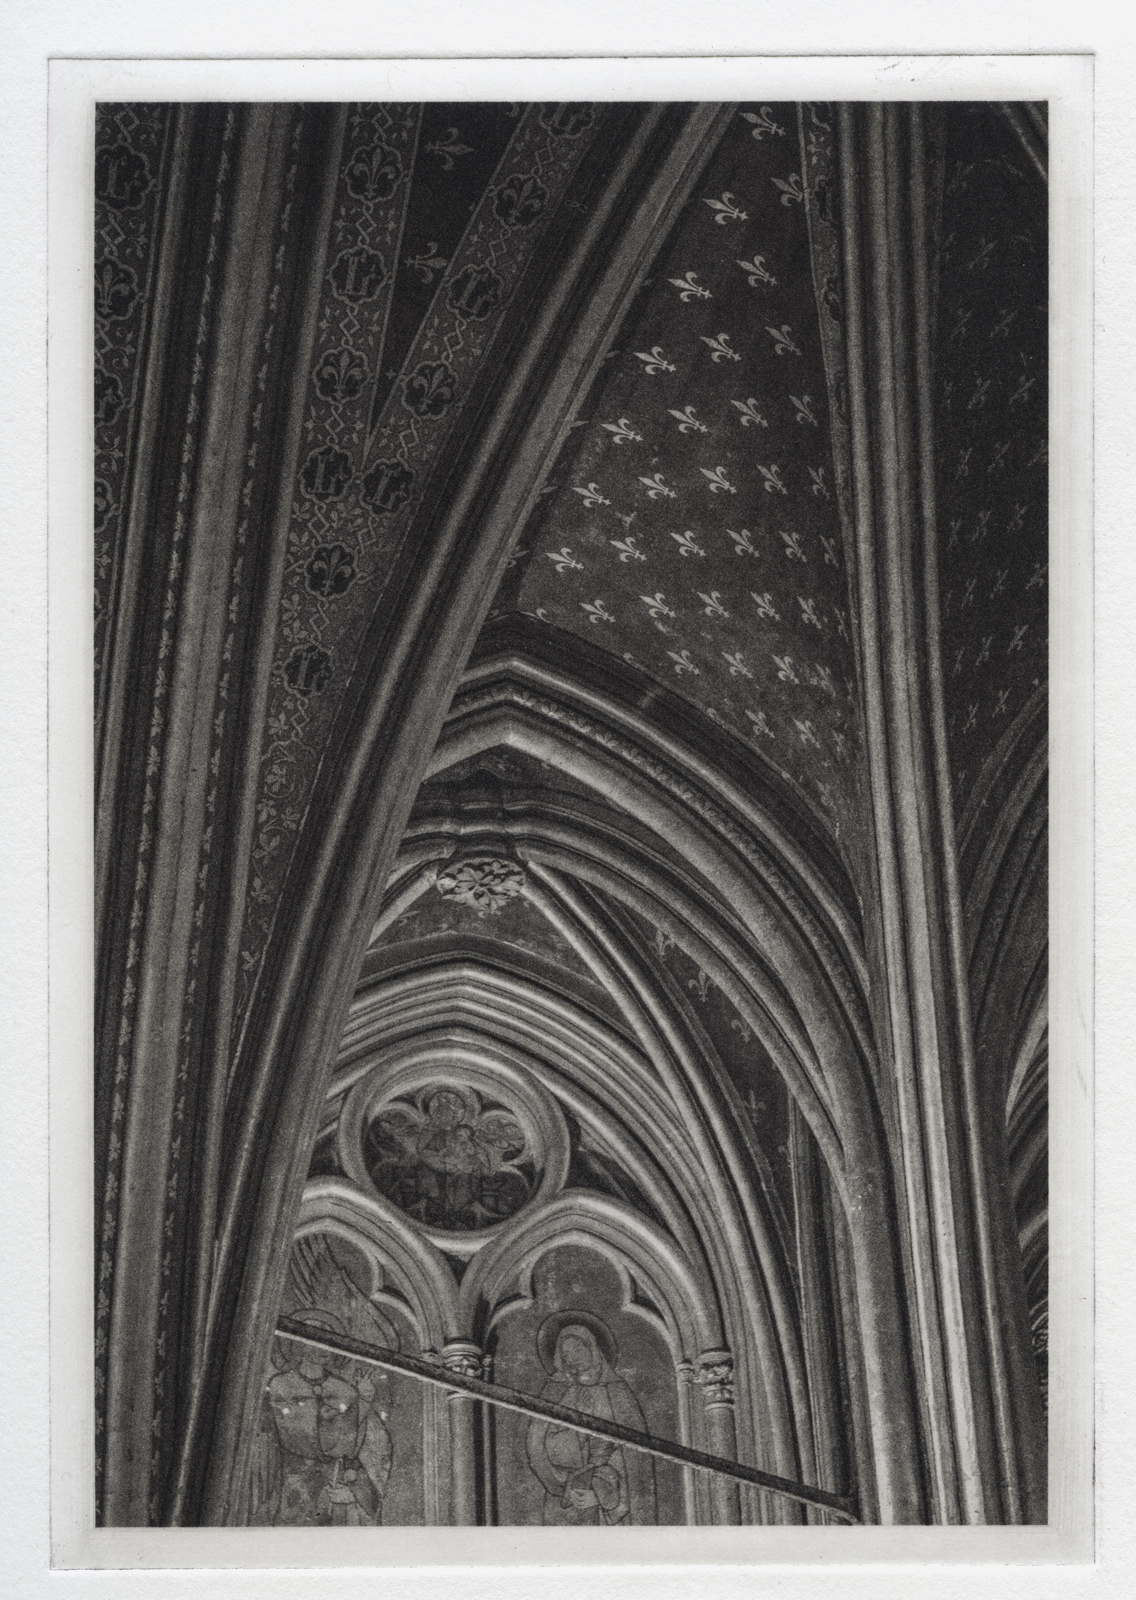
The same image printed with Print Tool Managed Color : Adobe 1998 - Perceptual Intent selected in the PrintTool Color Management Pane. Compared to image above, both the highlights and shadows have better contrast and more visual snap” %}
The differences are very subtle, but the Print Tool managed print has just a little more ‘pop’ and shadow contrast and would be my preferred printing workflow.
Conclusions
The QuadToneProfile app allows the polymer photogravurist the ability to quickly create linearized QuadToneRIP inking profiles for making polymer plates with the least amount of wasted material. The entire workflow is streamlined to the point where a only a few hours are required to achieve perfectly calibrated plates with a minimum of effort. No math is required, and the only workflow requirement that may be slightly out of the norm is securing access to a spectrophotometer or alternatively a reflectance scanning target. Used i1 Pro2 spectros are available on ebay, and if that is more than you want to spend, an inexpensive scanning target used with the QTR-StepWedge tool will enable someone with access to a scanner to achieve the same results.
This material is free for personal use but is copyrighted by Clay Harmon, 2019
