
DTP Quick Start
Photopolymer DTP with QTR & QuickCurve
Introduction
Direct-to-plate (hereafter referred to as DTP) is a method for making photogravure plates that uses an inkjet printer to print an image directly on a polymer plate prior to exposure, and that serves simultaneously as an image and an aquatint screen. It has many advantages which will be enumerated below. In the last few years, a number of polymer photogravure practitioners have begun developing direct-to-plate methods for making photogravure intaglio plates. Silvi Glattauer, Trace Nichols, Tariq Dajani, David Kachel, Don Messec, Greg Brophy and Michael Mutmansky are just a few of the people that I know of who have worked on developing techniques for this approach to photogravure. I am relatively late to the game, but I hope that this tutorial will outline a procedure I have developed to make polymer photogravure plates in a straightforward manner.
Advantages
- It eliminates the need for an aquatint screen
- It eliminates the need for calculating two exposures, which in the normal process involves one exposure for the screen and one for the image.
- It eliminates the need for printing a positive on expensive transparency material
- It is much simpler
Disadvantages
- At the current time, only Epson printers can be used because the technique takes advantage of the marvelous QuadToneRIP software.
- No control over the size of the grain in the aquatint screen. Vendors of aquatint screens often have a selection of grain sizes that allow some artistic control over that aspect of the final print.
Tools, Materials, Software and digital files
Polymer platemaking material and equipment.
This tutorial assumes that you have experience making plates, or have instructions that will guide you through the process. The examples have all been done using the Jet LSL-73SP intaglio polymer plates. These un-fussy plates are my favorite and should be washed out (etched in cool water) for 4 minutes.
An exposure unit that emits UV light around the 350nm wavelength is needed to expose the plates. This process does not require a vacuum frame.
QuadToneProfiler-QuickCurve software
BWMastery product information page
QuadToneRIP software installed for your Epson printer
QTR PrintTool software for printing.
(Note: this tutorial assumes you are using the MacOS version of these software tools)
Download and unzip the following files from my website
	1. A6-mK-limit-test.tif
	2. A6-StepTest.tif
	3. dtp-K-100.quad
	4. dtp-K-100-UC10.quad
	5. dtp-quick-start.pdf
Some type of measurement device that can create a file with LAB values for the linearization steps.
I use an XRite i1Pro2 spectrophotomer and i1 Profiler software. Another alternative is to use the QTR-StepWedge-Tool app available here and a flatbed scanner in conjunction with a calibrated reflectance target such as the Tiffen Q13 to generate the measurement files
The calibration steps
- Make a carrier for your plates from 2-ply mat board and make sure the black ink on the printer is matte Black.
- Print the A6-mK-limit-test.tif image file in QTR calibration mode onto an unexposed plate using 1440-super resolution and uni-directional printing.
- Expose the two step strips on the plate using different exposures - probably about 125% and 175% of your combined screen+image exposure using traditional methods.
- Process the plate and then make a print using the plate.
- Evaluate the print and find the darkest step and the exposure that produces no open bite visible on the plate.
- Open the dtp-K-100.quad (or dtp-K-100-UC10.quad if using a 10 ink printer) and use the Quad Levels Utility in QuickCurve to create a linear single matte black printing profile with ink limit set to the value found in step 5. Save this but do not install the profile yet.
- Count the number of steps between 0 and the chosen maximum K value in step 5 and create a single row measurement target in i1 Profiler with the same number of steps.
- Measure these steps using the i1 spectrophotometer or other instrument, and save the results to a measurement file.
- Using the QuickCurve linearization tab, load the measurement data and adjust the smoothing sliders to make a smooth curve through the measured points. Load the previously saved K-limited quad and create a new .quad curve that has this preliminary linearization.
- Install this quad file in your QTR printer installation folder and double click to install.
- Print the A6-StepTest.tif file using this new ink profile with no color management selected.
- Measure this print using the 51-step series, creating a new 51-step measurement file.
- In the QuickCurve linearization tab, load this 51-step measurement data and adjust the smoothing sliders as in the previous steps. Load the previously linearized quad file and use the 51 step measurements to create a new 51-step-linearized quad file.
- Print the 51-step evaluation file again with the new 51-step linearized quad file.
- Make another plate with this positive and expose, process and print the plate.
- Measure this print using the 51-step series, and confirm that your quad file is close to perfectly linear.
- Iterate the process as needed to get a perfectly linearized 51-step measurement, using the new measurements to linearize the previous .quad file.
- Print a test image using PrintTool using Print-Tool Managed Color and choose Adobe 1998 2.2 as an output profile.
Carrier (1)

Printing the A6-mK-limit-test.tif image (2-4)


Evaluating the A6-mK-limit-test print (5)
Evaluate both the print and the un-inked plate to determine the maximum black ink value that does not result in open bite on the plate


Creating a mK-only linear quad file (6)
Using the QuickCurve application, open the dtp-K-100.quad file and adjust the black level to the value chose in step 5, and save the new .quad file. Do not install it yet!

Create a custom step wedge in the i1 application and measure the gray values (7-8)
Count the number of steps between 0 and the black value chosen, and then create a custom test strip in the i1Profiler application. Measure the steps using your i1 and save the measurements to a file.
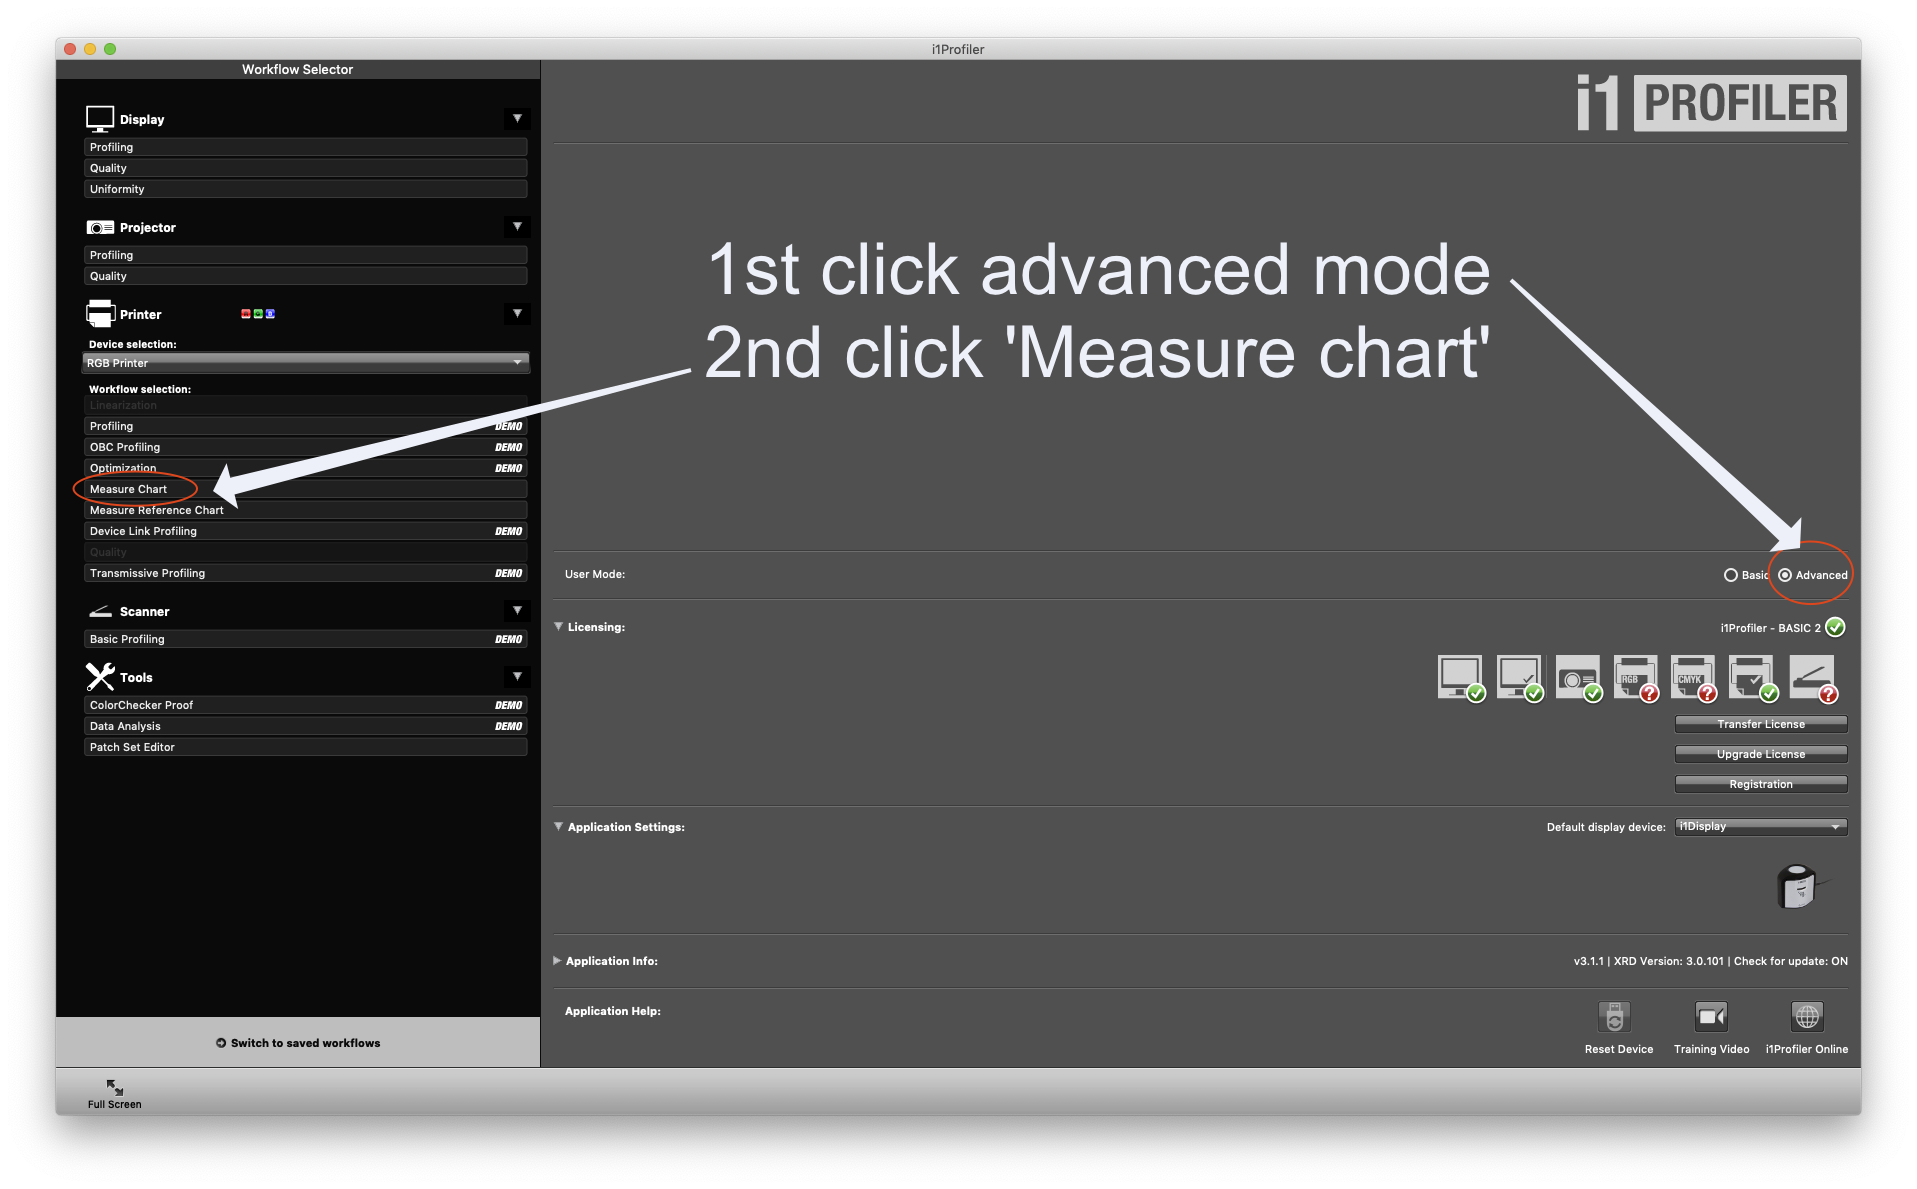
The i1 Profiler application can be downloaded from the x-Rite website. The part of the i1 Profiler we will be using does not require a full license. Open the i1 application and select ‘Advanced Mode’ with the radio button on the right, and then select the ‘Measure Chart’ function on the left that will appear once ‘Advanced mode’ has been selected.
Create a custom test chart with the number of steps between zero and the maximum mK ink value chosen above. Choose ‘1 row’ and the number of columns needed for the custom chart in the ‘Define Chart’ step.

Use the QuickCurve application to create a preliminarily linearized .quad file and install it (9-10)
Using the QuickCurve application, open the measurement file created with the i1Profiler app, and then the mK limited .quad file and then adjust smoothing sliders. Save the preliminary linearized .quad file to your QTR profile installation folder, and then install the profile by double clicking the InstallPrintername.command icon.

Using Print Tool, print the A6-StepTest.tif file using the new .quad file inking profile (11-12)
Make a plate using the preliminary .quad file. Expose, process, harden and print the plate. Measure the 51 step tablet using the i1Profiler app. Save the measurements to use in final linearization step.


Use the QuickCurve application to fine-tune the linearization with the measured 51-step data (13)
Although the quad file already produces a very decent linearization, using the 51-step results will get the final .quad file close to perfect. Save this file and install it in the QTR profile installation folder.

Optional: print the A6-StepTest.tif file again and iterate as needed (14-17)
Although this is already a very good profile, feel free to chase perfection and print the A6-StepTest.tif file again with the 51-step linearized profile and tweak as patience allows.
Make a print from a real image file (18)
Make an actual print of an image. In the Color Management dialog area, allow Print Tool to manage color and choose Adobe 1998 2.2 as an output color profile.

Extra credit: Make custom curves
Using the existing penultimate curve and measurement data, the user can make custom curves that emphasis highlights, shadows, midtone contrast or whatever patience and good taste allow. Use the three sliders in the QuickCurve linearization tab to adjust these parameters, and then save the .quad file to the installation directory for installation as special curves for special images.

This material is free for personal use but is copyrighted by © Clay Harmon, 2019